Introduction
In this post we will explore some of the issues inherent in solar powering a small, connected sensor project. We will discuss the basics of solar panels, power budgeting and optimising power consumption through hardware and software, illustrating the discussion with a real-world example based on a simple environment monitoring sensor system.
It should be noted that not all projects are amenable to solar power and obtaining a sustainable solar solution imposes significant constraints. These constraints will be a major topic of the following discussion.
In this article our focus will be on low power panels (< 5 W) suitable for small sensor projects, rather than large domestic or industrial installations, although the principals remain the same.
Solar Panels
Solar panels are photovoltaic systems that convert light energy into electrical energy. A typical solar panel consists of a number of individual silicon photovoltaic cells suitably connected together to give the required voltage and power outputs and mounted on a rigid substrate with additional protection from the elements.
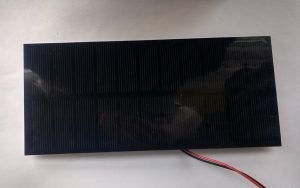
Figure 1. A 5 Volt, 2 Watt solar panel
A solar panel is specified by its power and voltage outputs. It should be noted that the quoted power output is typically a maximum figure and that the power output varies massively depending on the overhead conditions. Indeed, it is common to specify these values for Standard Test Conditions (STC) which corresponds to an irradiance of 1000 W/m2 and 25oC (the maximum irradiance in the UK on a cloudless summer day is about 800 W/m2).
Voltage values are either specified as typical or open-circuit or both. The typical voltage refers to the voltage obtained when driving a real load, under favourable lighting conditions (typically STC). Current values are either specified as typical or short-circuit or both. The typical current refers to the current obtained when driving real loads under optimum lighting conditions (typically STC).
Other important properties of the Solar Panels are its dimensions (hence surface area) and its efficiency. The surface area and efficiency of a solar panel determine its power output. The efficiency of solar panels is in the range of 15 % – 20 %, with a typical value being 17 %.
Estimating the Power Output of a Solar Panel
We can use the surface area and efficiency of a solar power to estimate its power output for any irradiance. This is very useful for exploring the feasibility of solar power for a project and can be used to estimate the size of solar panel required. To make use of these parameters we need to get a feel for typical irradiances produced by various lighting conditions (see below).
Clear sky summer 800 W/m2
Cloudy sky summer 200 W/m2
Indoor artificial light 1 W/m2
However, perhaps the most useful value to know is the average annual solar irradiance, which for the UK is about 100 W/m2. This figure is the average over the full 24 hour day (i.e. including night time) averaged over the year. This figure can be used to estimate the viability of a solar project as follows:
Power Output of Solar Panel = Area x Irradiance x Efficiency
So for a 10 cm by 10 cm solar panel, with an efficiency of 17 %, it’s average power output in the UK would be
Psp = 0.1 x 0.1 x 100 x 0.17 Watts
= 0.17 W
If the solar panel has a typical voltage of 5 V, then the average current output (using P = V x I) will be
I = 0.17/5 = 0.034 Amps
= 34 mA
Remember, this is an estimate of the maximum power (current), assuming a perfectly positioned solar panel and no losses in the system. So in reality, the useful current output would be nearer 10 mA.
Also, it is worth noting that a solar panel of this size would rated as a 1.5 W solar panel (STC) in the sales literature!
What Happens at Night?
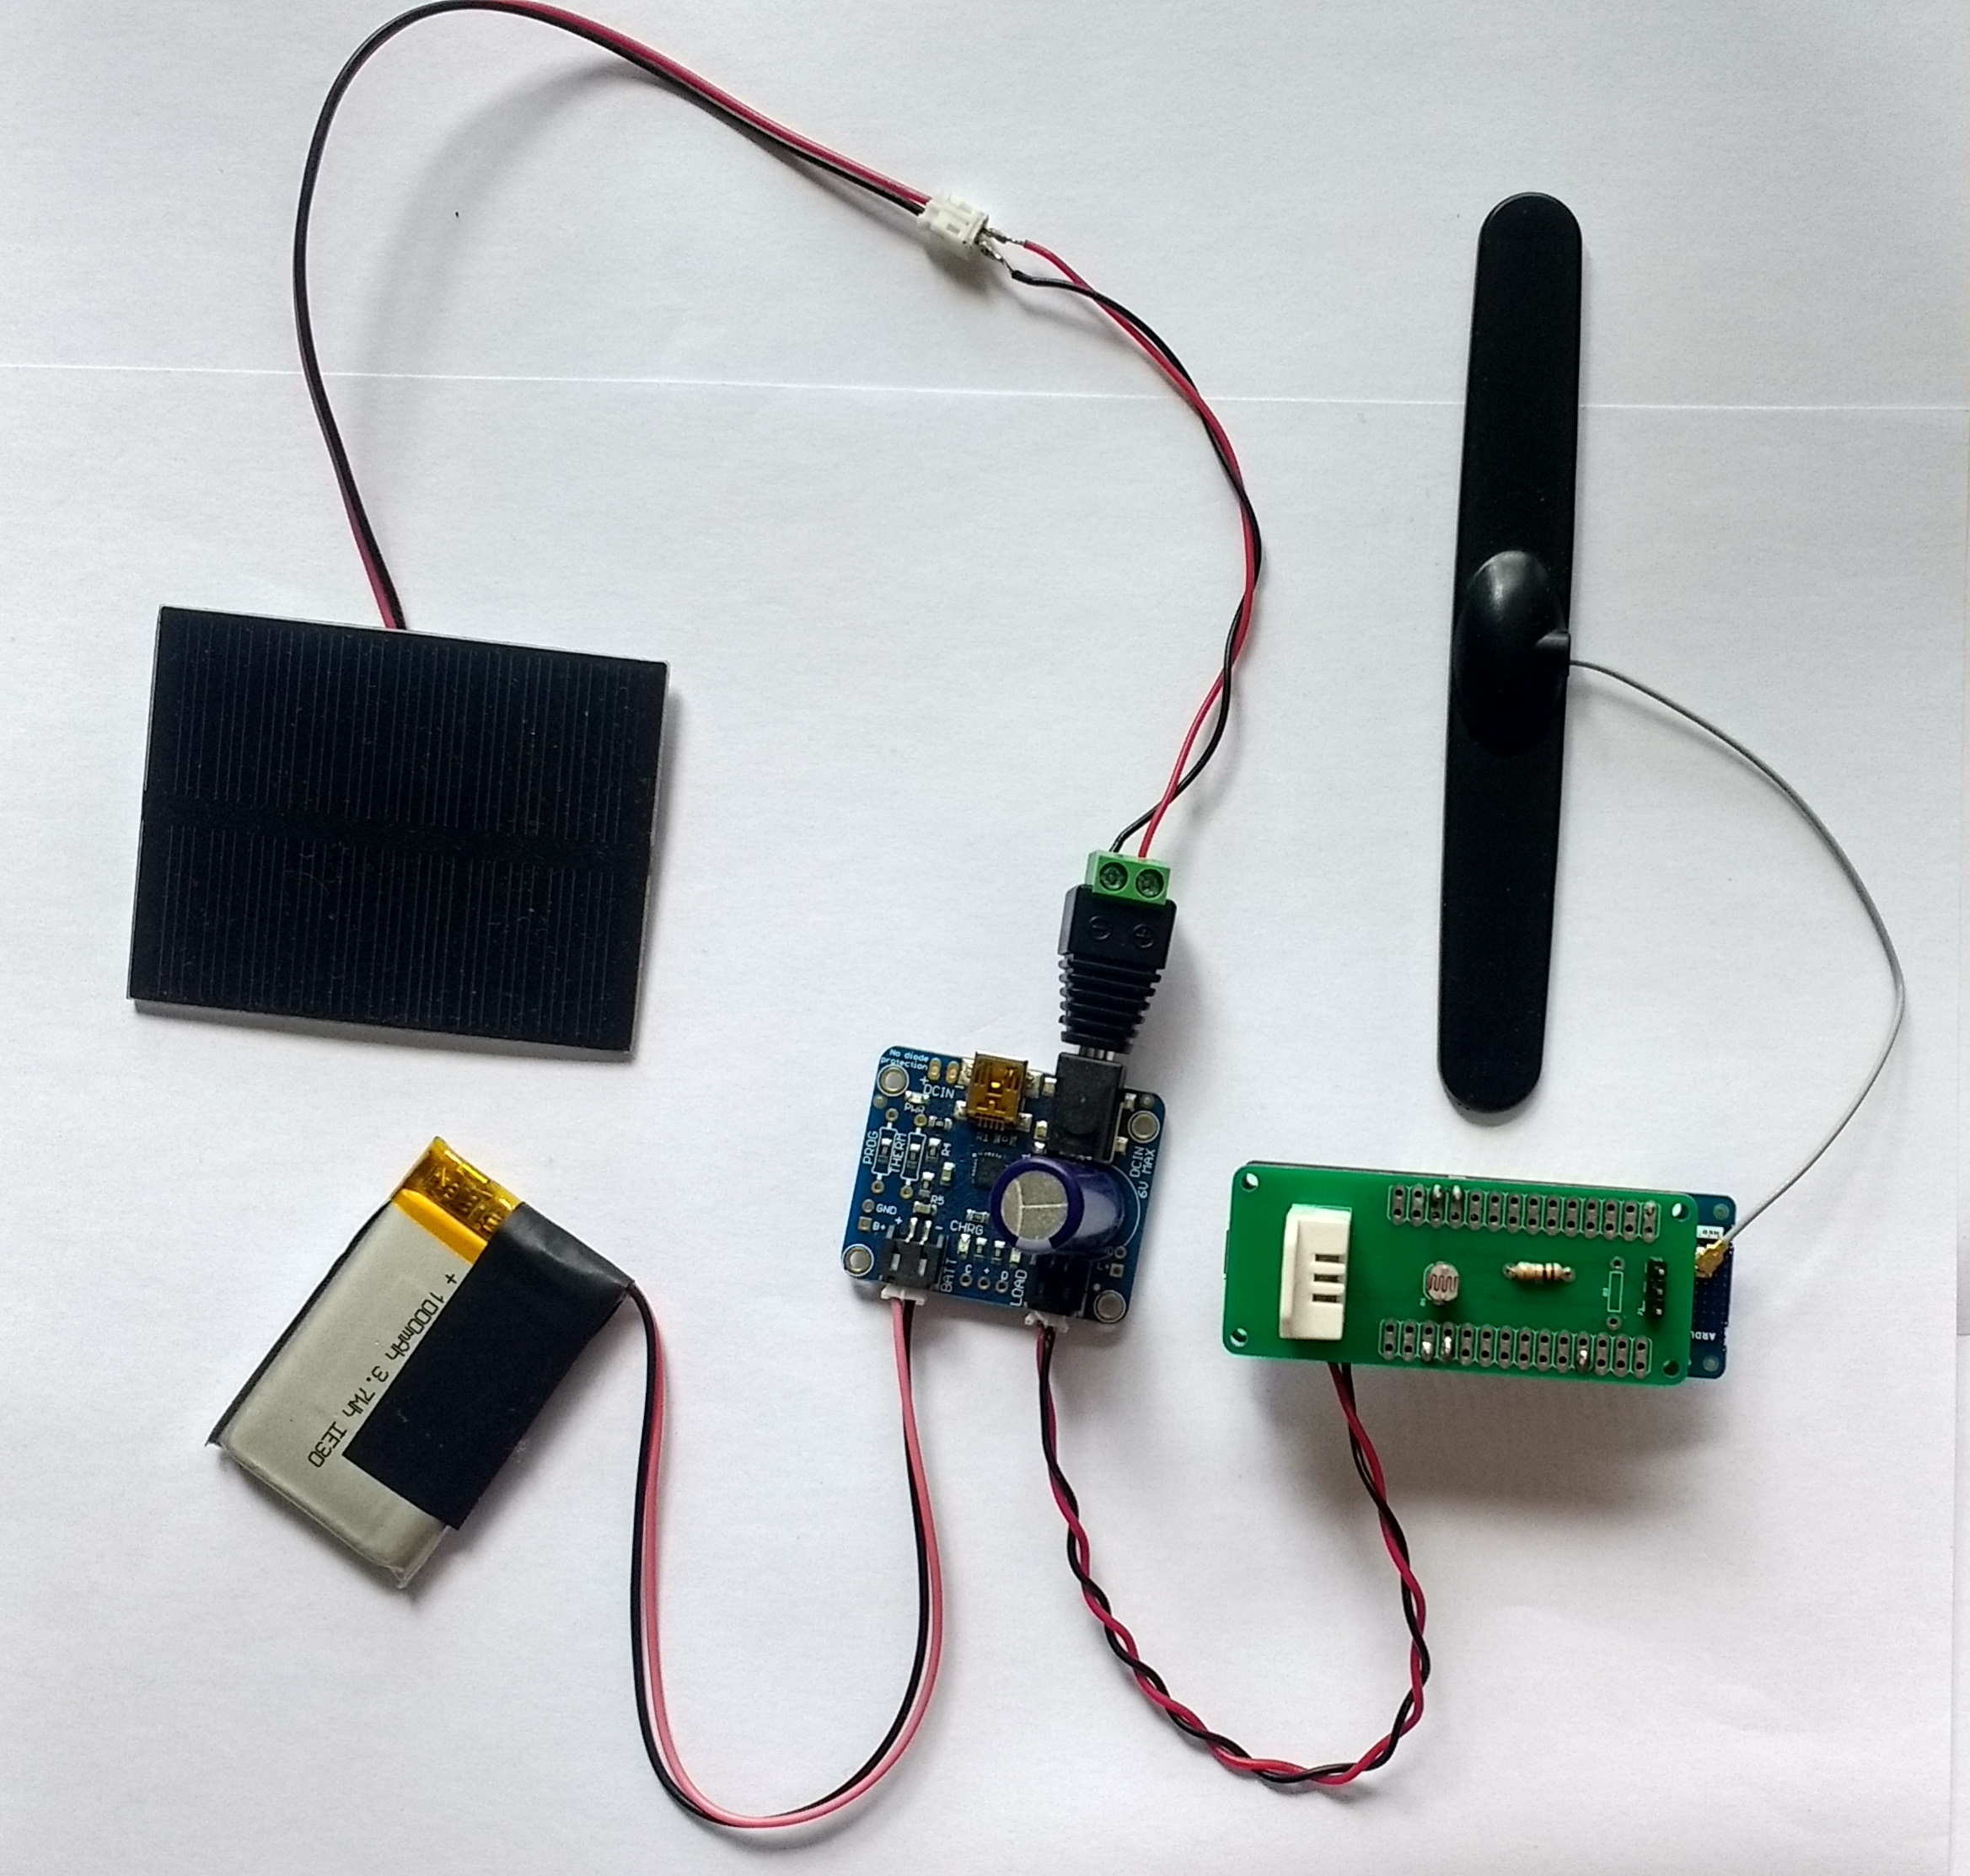
Assuming you have estimated the power budget of your project and used this to arrive at a suitably sized solar panel, you still have to consider what happens to your system at night, when the output of your solar panel drops to zero. The most common way to ensure continuity of supply is to use a rechargeable battery as ballast (although alternative solutions using super capacitors are becoming more popular). So the battery powers the project and the solar panel keeps the battery topped up. There are various types of rechargeable battery (e.g. Sealed Lead Acid, Nickel-Metal Hydride, Lithium Polymer …) each with their own charging requirements. Lithium Polymer (LiPo) batteries, which we used in this project, are particularly sensitive with respect to their charging characteristics, so it makes sense to use a dedicated charging circuit. In this project we used the Adafruit Solar Li Po charger, which worked well (see Fig. 2 below).
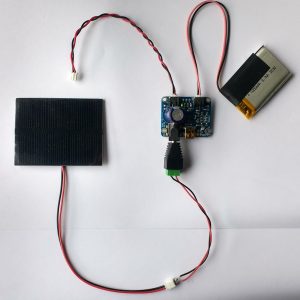
Figure 2. Adafruit solar charger with panel and battery connected. The unconnected lead powers the load – in this case an Arduino.
Maximum Power Point Tracking
Solar panels, being semiconductor devices, are highly nonlinear. They are characterised by what is known as an I V curve (see Fig. 3 below).
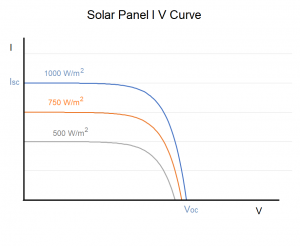
Figure 3. Solar panel I V curve for several irradiances
This shows the relationship between the current and voltage output for varying load conditions and at various incident irradiances. It is worth noting that the current output varies linearly with irradiance, whilst the voltage varies little with irradiance, which is handy for a practical power source.
The maximum voltage possible, Voc, is developed across an open circuit, resulting in no current and zero power delivery. Similarly, shorting the solar panel, produces the maximum current output, Isc, but at zero voltage and again zero power. The consequences of this can be better understood by adding power (the product of I and V) to the I V curve as shown below.
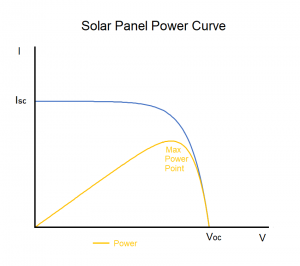
Figure 4. Solar panel power curve
As you can see there is a point on the I V curve at which the solar panel delivers maximum power. Extracting maximum power from the panel is a matter of arranging the load (impedance) of the circuit being driven by the solar panel, so that the panel always operates at its Maximum Power Point. Since the maximum power point varies with incident irradiance, this is not a trivial task, although ‘off the shelf’ Maximum Power Point Tracking (MPTT) circuits are available. Fortunately, the power curve is reasonably broad and useful power can be obtained from the solar panel over a range of loads. The Adafruit solar charger used in this project is not a true MPTT device, but works well nonetheless. The fact that your solar panel may not be operating exactly at its maximum power point is one of the system losses you need to take into account when estimating the size of panel needed for your project, so make sure you allow plenty of headroom.
Microcontroller Design Choices
Deploying a sustainable solar solution involves some design choices and compromises. For example, an Arduino Uno WiFi Rev 2 board when connected over WiFi draws between 90 and 150 mA. Taking a ball park figure of 100 mA what sized panel would we need for an outdoor deployment in the UK? Allowing for various losses we might estimate that we need a power output (P = V x I ) from our panel of at least 1 Watt (5 x 0.2) at an irradiance of 100 W/m2.
Since
Psp = Area x Irradiance x Efficiency
We can see that
Area = 1/(100 x 0.17)
Area = 0.06 m2
which is equivalent to a square panel of 25 x 25 cm. That’s quite a large and expensive solar panel.
However, if we are deploying our project “in the wild”, WiFi may not be the best medium. Instead, we can look at LoRa, a low power, long range wireless protocol designed for Internet of Things applications. A number of microcontroller boards are available supporting LoRa; for this example we chose the Arduino MKR WAN 1310 (see Fig. 5 below).
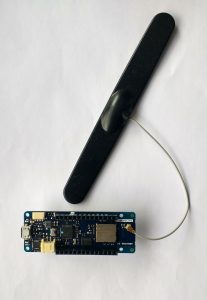
Figure 5. The Arduino MKR WAN 1310 with aerial attached
The advantage of this microcontroller board is that it can be configured to opereate at sub-milliamp currents as low as 100 microamps, making it a great option for solar power.
LoRa and the Things Network
LoRa is a transport protocol (think HTTP) and the Arduino MKR WAN 1310 acts as a LoRa client. So we also need some backend infrastructure to act as a server and receive our sensor data. In this example we used the Things Network as the backend. The Things Network (TTN) is an open, community-based foundation leading an effort to build a global LoRa network. To support this effort TTN makes available affordable hardware solutions (for example Arduino-based LoRa boards and LoRa Gateways) as well as a backend infrastucture that provides an endpoint for LoRa client data. Currently TTN supports more than 10,000 LoRa Gateways in hosted in 150 countries around the world
To use LoRa and the Things Network we need a suitable LoRa Gateway (think WiFi Access Point) in proximity to our client (the MKR WAN 1310). The LoRa Gateway creates a local LoRa ‘cell’ to which multiple LoRa clients can connect to. The LoRa Gateway itself is connected to the Things Network backend infrastructure via the internet (using either Ethernet or WiFi). The great thing about LoRa, apart from its low power, is its long range; with typical values quoted as 10 km, so one LoRa Gateway can serve a wide area. In this example we used the Things Gateway for our LoRa Gateway which integrates seemlessly into the Things Network infrastructure.
Sensor Circuit
The sensor circuit used in this example uses a combined humidity and temperature sensor (the DHT22) and a light dependent resistor (LDR) to measure light levels (see Fig. 6). The circuit is similar to that used for our plant monitor featured in a previous blog post but without the soil-moisture sensor. The reader is refered to the earlier post for details of the use and calibration of the sensors. The sensors interface to the Arduino MKR WAN 1310 via the analog pin 2 (LDR) and the digital pin 2 (DHT22).
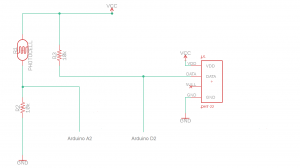
Figure 6 A simple sensor circuit featuring a DHT22 temperature/humidity sensor and a light dependent resistor
Sketch
TTN Code
Before using the Things Network it is necessary to register as a new user on the Things Network. Once registered as a user we also need to register our device with the network, and add our application to our account.
Now, let’s look at code snippets for interfacing to the Things Network.
#include <MKRWAN.h>
LoRaModem modem;

// Set your AppEUI and AppKey
const char* appEui = "<APP-EUI>";
const char* appKey = "<APP-KEY>";

// Replace REPLACE_ME with TTN_FP_EU868 or TTN_FP_US915 #define freqPlan TTN_FP_EU868
#define freqPlan TTN_FP_EU868
The first line includes the Arduino MKRWAN library needed by the sketch for LoRa integration. Next, we create a LoRaModem object and then specify the App Eui and App Key values, which were created by the TTN console when our application was added (see above). Finally, we need to specify the frequency band as there are different frequency bands used in Europe and the USA due to differing local regulatory regimes. In Europe the Things Network uses the 863-870 MHz portion of the ISM band.
Now let’s look at the setup()code.
void setup(){

  //Initialise sensors
  ...

  while (!modem.begin(EU868)) {
    delay(1000);
    Serial.println("Failed to start module");
  };

  int connected = modem.joinOTAA(appEui, appKey);

  if (!connected) {
    Serial.println("Something went wrong; are you indoor? Move near a window and retry");
  }else{
    Serial.println("Connected!");
  }

}
First, we start the onboard LoRa modem and then connect to the Things Network via the local LoRa Gateway. The modem connects to the nearest gateway (assuming one or more are in range). This initialisation only needs to be done once.
Finally, let’s look at the loop() code for transmitting the sensor data.
void loop(){
  //Get sensor values
  ...

  modem.beginPacket();

  // Split both words (16 bits) into 2 bytes of 8
  byte payload[6];
  payload[0] = highByte(temperature);
  payload[1] = lowByte(temperature);
  payload[2] = highByte(humidity);
  payload[3] = lowByte(humidity);
  payload[4] = highByte(light);
  payload[5] = lowByte(light);

  modem.write(payload, sizeof(payload));

  err = modem.endPacket(true);

  if (err > 0) {
    Serial.println("Message sent correctly!");
  } else {
    Serial.println("Error sending message :(");
  }

  delay(120000);

}
The code snippet above assumes the sensor values are encoded as 16-bit integers. To minimise bandwidth usage the data is transmitted as binary. So each 16-bit integer is broken down into bytes and the payload for the three sensor values sent as a 6 byte long binary payload.
The Things Network imposes a ‘Fair Use’ policy which imposes limitations on size and frequency of transmission of data packets. So, after sending the sensor data we pause the loop for 120 seconds to remain within fair usage. Some boards actually implement the fair use policy at the hardware level and will return an error if the sketch attempts to exceed the fair use limits.
The complete sketch is available on GitHub.
Lower Power Code
The Arduino platform supports several low power libraries targeted at specific hardware architectures that can be used to reduce the current draw of the device when not actively reading sensors or transmitting or receiving data. The Arduino MKR WAN 1310 uses the SAMD21 MCU (based on the ARM Cortex architecture). Consequently we used this Arduino Low Power library, which is written for SAMD architecture. To make use of this library we include the relevant header file as follows:
#include <ArduinoLowPower.h>
In the loop() method, after we have uploaded the sensor data we put the device into a low power state as shown below.
void loop(){
  //read sensors and prepare payload
  ...
  modem.write(payload, sizeof(payload));
  err = modem.endPacket(true);
  ...

  modem.sleep(120000);
  LowPower.deepSleep(120000);
}
The final two lines (8 and 9) i) put the onboard LoRa modem into a low power state and ii) put the Arduino into a low power state with most peripherals disabled except the real time clock to allow for wake up. These low power optimisations can reduce the current draw of the MKR WAN 1310 board to around 100 microamps. We no longer need the delay(120000); line of code in the loop() method as LowerPower.deepSleep(120000); supercedes it.
However, it is important to add a delay into the setup() method to allow for the upload of new sketches.
void setup(){
  delay(20000); //allow some downtime to upload a new sketch

  //do other stuff
  ...
}
This is because once up and running our sketch will spend more than 90% of its time in the low power state, with most peripherals including serial communication disabled. To upload a new sketch we can use the Arduino reset button to restart the current sketch and then make use of the 20 second window to upload the new one.
Again the reader is referred to GitHub for the complete sketch.
Discussion
The final prototype is shown in Fig. 7 below. In this example we connected the output of the Adafruit solar charger to the battery input of the Arduino MKR WAN 1310, which is designed for LiPo battery operation. This is a bit of a hack that worked OK for our small solar panel but is not generally recommended for a couple of reasons: firstly,the voltage output of the solar charger varies according to solar conditions (and size of panel) and could potentially exceed the acceptable voltage input range; secondly, the Arduino MKR WAN 1310 incorporates a LiPO charging circuit that operates when the Arduino is powered via 5V USB and will attempt to charge your solar charger if both USB and solar charger are connected simultaneously.
A more robust solution is to regulate the output of the solar charger down to 3.3 V and power the board via the 3.3 V pin of the Arduino. In fact there are a number of further power optimisations possible with this board for the more intrepid.
Whatever microcontroller hardware is employed, it is important to read the specification as different boards operate at different voltages and may have different power requirements.

Figure 7. The final prototype
The solar panel used in the final prototype was a 5 Volt, 0.55 Watt (nominal) panel with dimensions 5.5 cm by 7 cm costing about £3. Again we can apply our power estimate to this solar panel using the average UK irradiance 0f 100 W/m2.
Psp = Area x Irradiance x Efficiency
Psp = 0.004 x 100 x 0.17 = 0.065 W
We can convert this to current by dividing by the panel voltage of 5 V giving
Isp = 0.013 amps = 13 milliamps
A multimeter was used to estimate the power budget of the Arduino system. After the initial set up and connection to the LoRa gateway, the sketch settles into the low power state where it draws between 300 and 400 microamps (mainly attributable to the current through the LDR circuit). When transmitting sensor data (once every two minutes) the current consumption briefly (for less than a second) rises to 30 milliamps and then returns to the sub-milliamp state. The Things Network backend console indicates the airtime required for the transmission of a single payload as 36 milliseconds. Even allowing for the transmission peaks, it is clear the long term average current draw from the Arduino sensor system is less than one milliamp, meaning it should easily achieve sustainable solar operation using the small solar panel employed here.
Indeed, at the time of writing this system has been running for more than two months without a battery recharge despite being deployed indoors, albeit adjacent to a large window that accepts large amounts of natural light. Furthermore, at various times during extended sunny periods the battery achieved full charge according to the Adafruit solar charger LED indicator.
A screenshot of the Things Network console showing the sensor data received by the Things Network backend is shown below.
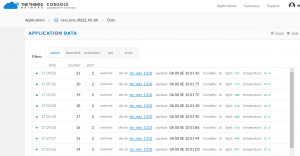
Figure 8. A screenshot of the Things Network console showing data uploaded by the sensor system
In summary, we have seen how a simple sensor project can be sustainably powered by solar energy using a small solar panel, providing attention is paid to optimising the system for low current operation. However, to achieve such operation entails a number of compromises. Firstly, we adopted LoRa as our transmission protocol and the Things Network as our network infrastructure, which imposes constraints on the size and frequency of sensor data transmission. Secondly, we adopted a more minimal array of sensors compared to our previous plant sensor example. The ‘off the shelf’ capacitive soil moisture sensor used in the previous project draws 4 mA (due to an integrated regulator) and makes the circuit unsustainable for the size of panel used here (at least for indoor operation), but could be incorporated either by using a larger solar panel or building a custom low-current capacitive moisture sensor, which is not hard to do.
Finally, it is worth doing some research on the particular microcontroller hardware employed as often there will be significant power optimisations possible at the board level, irrespective of the external sensors employed.