Introduction
In this post we describe a simple plant monitor that utilises an Arduino and a number of sensors to monitor environmental data relevant to the plant’s wellbeing. In particular, we use a soil moisture sensor, a combined humidity and temperature sensor and a light sensor. We will discuss calibrating the sensors, wiring up the circuit, programming the Arduino and aggregating the data and visualising it using a remote service.
Sensors
Soil Sensor
The most important sensor for monitoring the plant’s environment is a soil moisture sensor. Soil moisture sensors can be categorised into two types: resistive sensors and capacitive sensors (see Fig. 1).
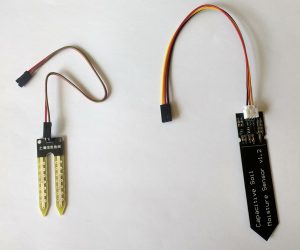
As the name implies, resistive sensors operate by measuring the resistance of the soil between the two prongs (electrodes), by applying a voltage across the electrodes and measuring the resulting current and then applying Ohm’s law to calculate the resitance. This means the sensor has to be in physical contact with the moist soil, which results in gradual corrosion of the electrodes. In contrast, capacitive soil moisture sensors rely on the electric field generated by the electodes to determine the capacitance of the surrounding medium (the soil) and can operate even when the electrodes are not in direct physical contact with the soil, reducing the potential for corrosion of the electrodes. Typically a thin layer of lacquer or varnish is applied to the electrodes to prevent corrosion. The pros and cons of the two types of soil moisture sensor is discussed in more detail in the following YouTube video:
In this project we tried both types of sensor but opted for capacitive sensors for the final prototype, which although more expensive, provide a superior performance over time for the reasons discussed above.
Combined Humidity and Temperature Sensor
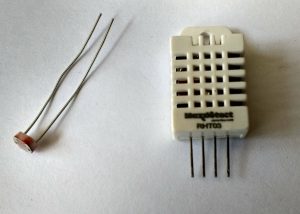
We used the DHT22 combined humidity and temperature sensor (see Fig. 2) in this project. The DHT22 is a four pin (although only three are used) digital sensor employing a fairly complex data protocol, however there are number of third-party libraries available that provide a simple API to access humidity and temperature measurements.
Light Sensor
A simple light dependent resistor (LDR) was employed as the light sensor (see Fig. 2). LDRs are cheap semiconductor devices whose resistance varies inversely with light intensity (more strictly irradiance in W/m2).
Circuit
The plant monitor was based around an Arduino microcontroller and a schematic of the circuit is shown below in Fig.3.
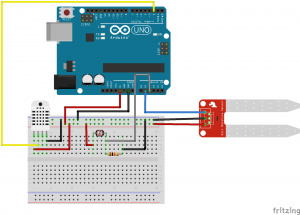
The DHT22 sensor data terminal is connected to digital pin 2 of the Arduino microcontroller. The data output of the soil moisture sensor is connected to analog pin 1. The LDR is wired as a voltage divider, in series with a 10 kilo Ohm resistor, with the junction between the LDR and the 10 kilo Ohm resistor being connected to analog pin 2 of the microcontroller.
The power rail of the breadboard is fed by the 5V output pin of the microcontroller.
Calibration
DHT22 Sensor
The DHT22 humidity and temperature digital sensor is already calibrated and outputs humidity and temperature data directly.
Soil Sensor
Soil moisture sensors are typically calibrated by measuring the voltage output obtained from the sensor in air (dry) and from the sensor immersed in water (wet). These two extreme values can then be mapped to a range of 0-100, so that the actual value obtained from the sensor when embedded in soil represents a soil moisture percentage. The actual soil moisture value can then be obtained from the sensor voltage output by using the Arduino mapfunction as follows:
float soilVolts = Vcc*analogRead(moisturePin)/1024;
int moisturePercent = map(soilVolts, airVolts, waterVolts, 0, 100);
Light Dependent Resistor
The light dependent resistor needs some form of calibration to convert its resistance into a light level. The first thing we need to determine, in order to estimate the light level, is the instantaneous resistance of the LDR.
We can use the voltage measured at the junction of the LDR and 10 kiloOhm resistor to estimate the resistance of the LDR by applying Ohm’s law applied to the voltage divider formed by the LDR in series with the 10 kiloOhm resistor (see Fig. 4).
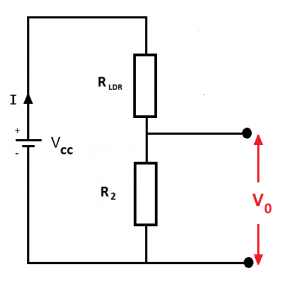
If V0 is the voltage measured at the junction of the LDR and 10 kiloOhm resistor, then
V0 = I R2
and
I = Vcc /(RLDR + R2)
Substituting for I and rearranging we get
RLDR = R2(Vcc – V0)/V0 = (R2Vcc/V0) – R2
Since Vcc = 5 Volts and R2 = 10 kOhms, then
RLDR = (50/V0) – 10
where RLDR is the resistance of the LDR in kiloOhms.
Since LDRs are semiconductor devices, the relationship between resistance and light level is highly nonlinear and it’s common to represent it as a Log v Log response. To obtain an absolute calibration would require using a calibrated Lux meter as a reference. However, we can perform an approximate calibration using datasheets (we used a GL5528 LDR) and empirical observations. In order to display our light on the same axis as our moisture readings we used a scale of 0% to 100% and assumed a resistance of 10 Ohms at high light levels (100%) and 1 Mega Ohm at low light levels (0%). We can map the Log of RLDR onto the 0-100% range using the Arduino mapfunction (resistance being measured in kiloOhms):
int lightPercentage = map(log10(Rldr), 3, -2, 0, 100);
Since the Arduino mapfunction uses only integer arithmetic you will get better results by solving the relationship by hand in which case the linear relationship can be represented by:
double lightPercentage = 20.0*(3.0 - log10(Rldr));
Basic Sketch
The code below is a basic standalone Arduino sketch that monitors the three sensors, incorporating the calibration described earlier.
#include <math.h>
#include <DHT.h>

#define moisturePin A1
#define lightPin A2
#define DHTPIN 2 //digital
#define DHT_TYPE DHT22

const float Vcc = 5.0f;

const float airVolts = 2.9f;
const float waterVolts = 1.4f;

DHT dht(DHTPIN, DHT_TYPE);

void setup() {
  dht.begin(); //Initialise the DHT sensor
  Serial.begin(9600); // Initialise Serial debug output
  while (!Serial && millis() < 10000)
    ; //Wait a maximum of 10s for Serial to open
}

void loop() {
  float soilVolts = Vcc*analogRead(moisturePin)/1024;
  int moisturePercent = map(soilVolts, airVolts, waterVolts, 0, 100);
  Serial.print("moisture = ");
  Serial.println(moisturePercent);

  int humidity = dht.readHumidity();
  Serial.print("humidity = ");
  Serial.println(humidity);

  int temperature = dht.readTemperature();
  Serial.print("temperature = ");
  Serial.println(temperature);

  double ldr = Vcc*analogRead(lightPin)/1024.0;
  Serial.print("ldr voltage: ");
  Serial.println(ldr);

  double Rldr = (Vcc*10.0/ldr) - 10.0;
  Serial.print("LDR resistance (kOhms): ");
  Serial.println(Rldr);

  double lightPercent = 20.0*(3.0 - log10(Rldr));
  Serial.print("Light levels in percent: ");
  Serial.println(lightPercent);

  delay(2000);
}
This sketch could be extended to provide automatic watering of the plant by monitoring the soil moisture sensor and activating an irrigation system when the soil moisture value falls below a certain threshold. This enhancement is left as an exercise for the reader.
Data Aggregation and Visualisation
There are a number of portals that will store and visualise sensor data, some offering a free subscription for rate-limited data uploads. These typically support HTTP as a protocol and also MTTQ - a more lightweight protocol specifically designed for transporting sensor data.
It is also possible to build your own server stack using MQTT for transport, a time series database such as InfluxDB for storing data and a visualisation package such as Grafana for creating elegant graphics. However, this is beyond the scope of the current post. Instead, in this example we use one of the ready made solutions; io.adafruit.com.
The final sketch is available in GitHub and was written for the Arduino UNO WiFi Rev 2. It uses the WiFiNINA library for WiFi connectivity and the Arduino HTTP Client library to upload data via the Adafruit IO REST API. This requires a JSON payload, an example of which is shown below.
if (millis() - lastConnectionTime > postingInterval) {
    char payload[200];
    sprintf(payload, "{\"feeds\":[{\"key\":\"humidity\", \"value\":%d}, {\"key\":\"light\", \"value\":%d}, {\"key\":\"soil-moisture\", \"value\":%d}, {\"key\":\"temperature\", \"value\":%d}]}", humidity, (int)lightPercent, (int)moisturePercent, temperature);
    httpPostRequest(payload);
}
Access to the Adafruit IO service is rate-limited for free subscriptions, so in this example we only perform one upload a minute. The actual POST request is shown below:
void httpPostRequest(const char payload[]) {
  client.beginRequest();
  client.sendHeader("X-AIO-Key", "<YOUR-ADAFRUIT-IO-API-KEY");
  client.post("/api/v2/<your-username>/groups/<your-feed-name>/data", "application/json", payload);
  client.endRequest();

  // read the status code and body of the response
  int statusCode = client.responseStatusCode();
  String response = client.responseBody();

  Serial.print("Status code: ");
  Serial.println(statusCode);
  Serial.print("Response: ");
  Serial.println(response);

  lastConnectionTime = millis();
}
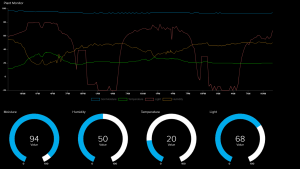
Adafruit IO uses a Grafana-based visual interface which is easy to customise. The resulting visualisation of our plant monitor data is shown below (Fig. 5).
Wrapping Up
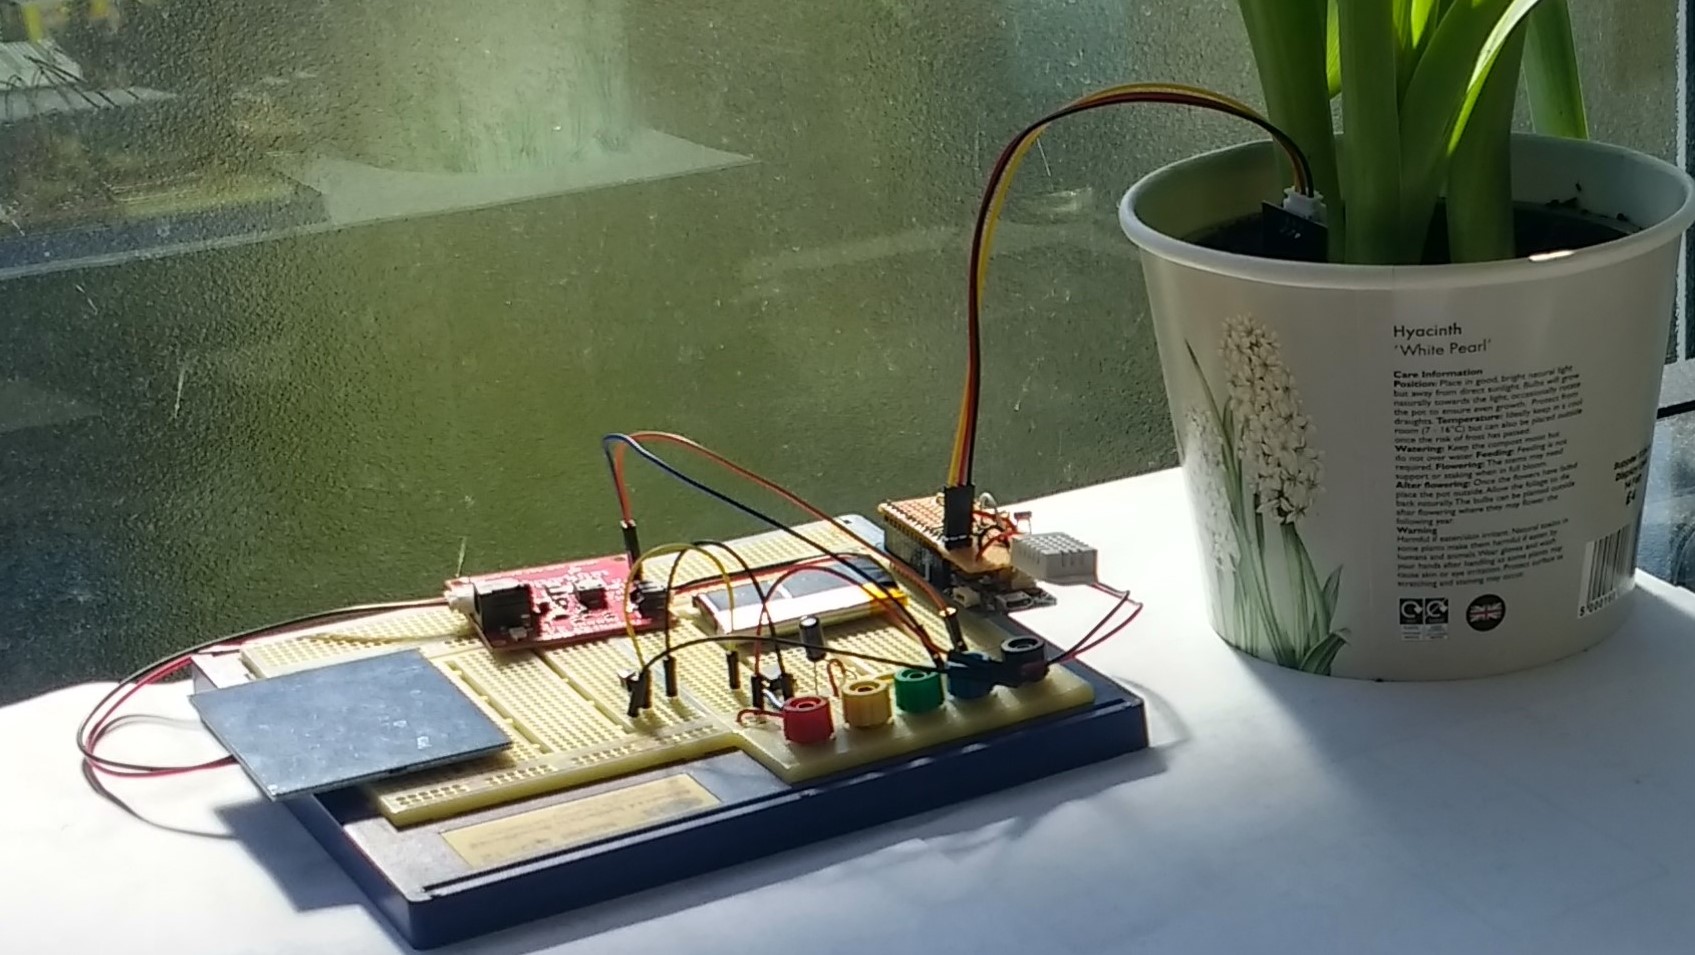
In this post we’ve discussed a simple Arduino-based plant monitor that senses the plant’s environment, in particular soil moisture, humidity, temperature and light levels. We have described calibration of the sensors and the aggregation and visualisation of the sensor data as well as the basic circuit. The final prototype is shown below in Fig. 6.
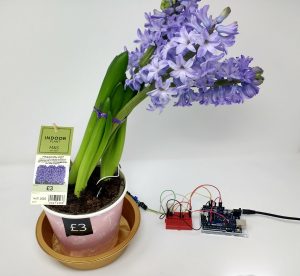
If you are interested in creating your own plant monitor it is worth doing some research as there are a numerous online examples, featuring a variety of approaches to monitoring the health of your plant, including self-irrigating systems and integrated plant pots.