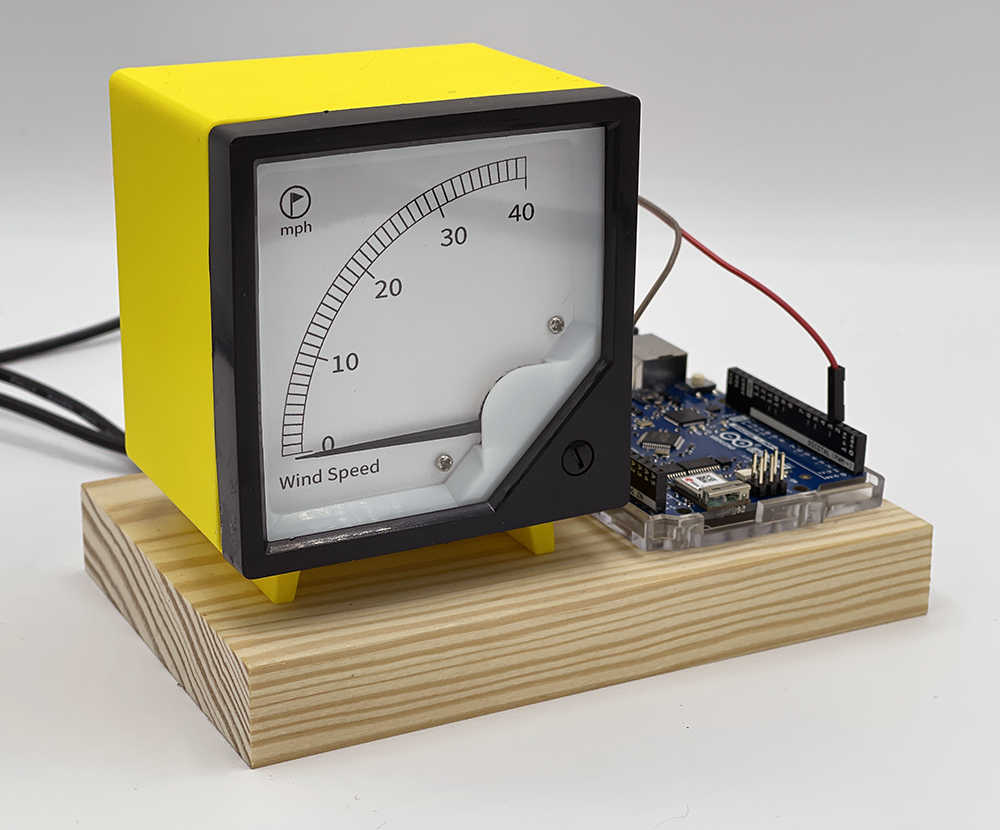
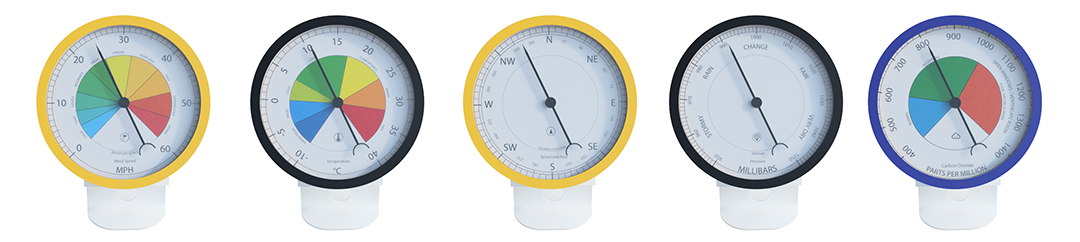
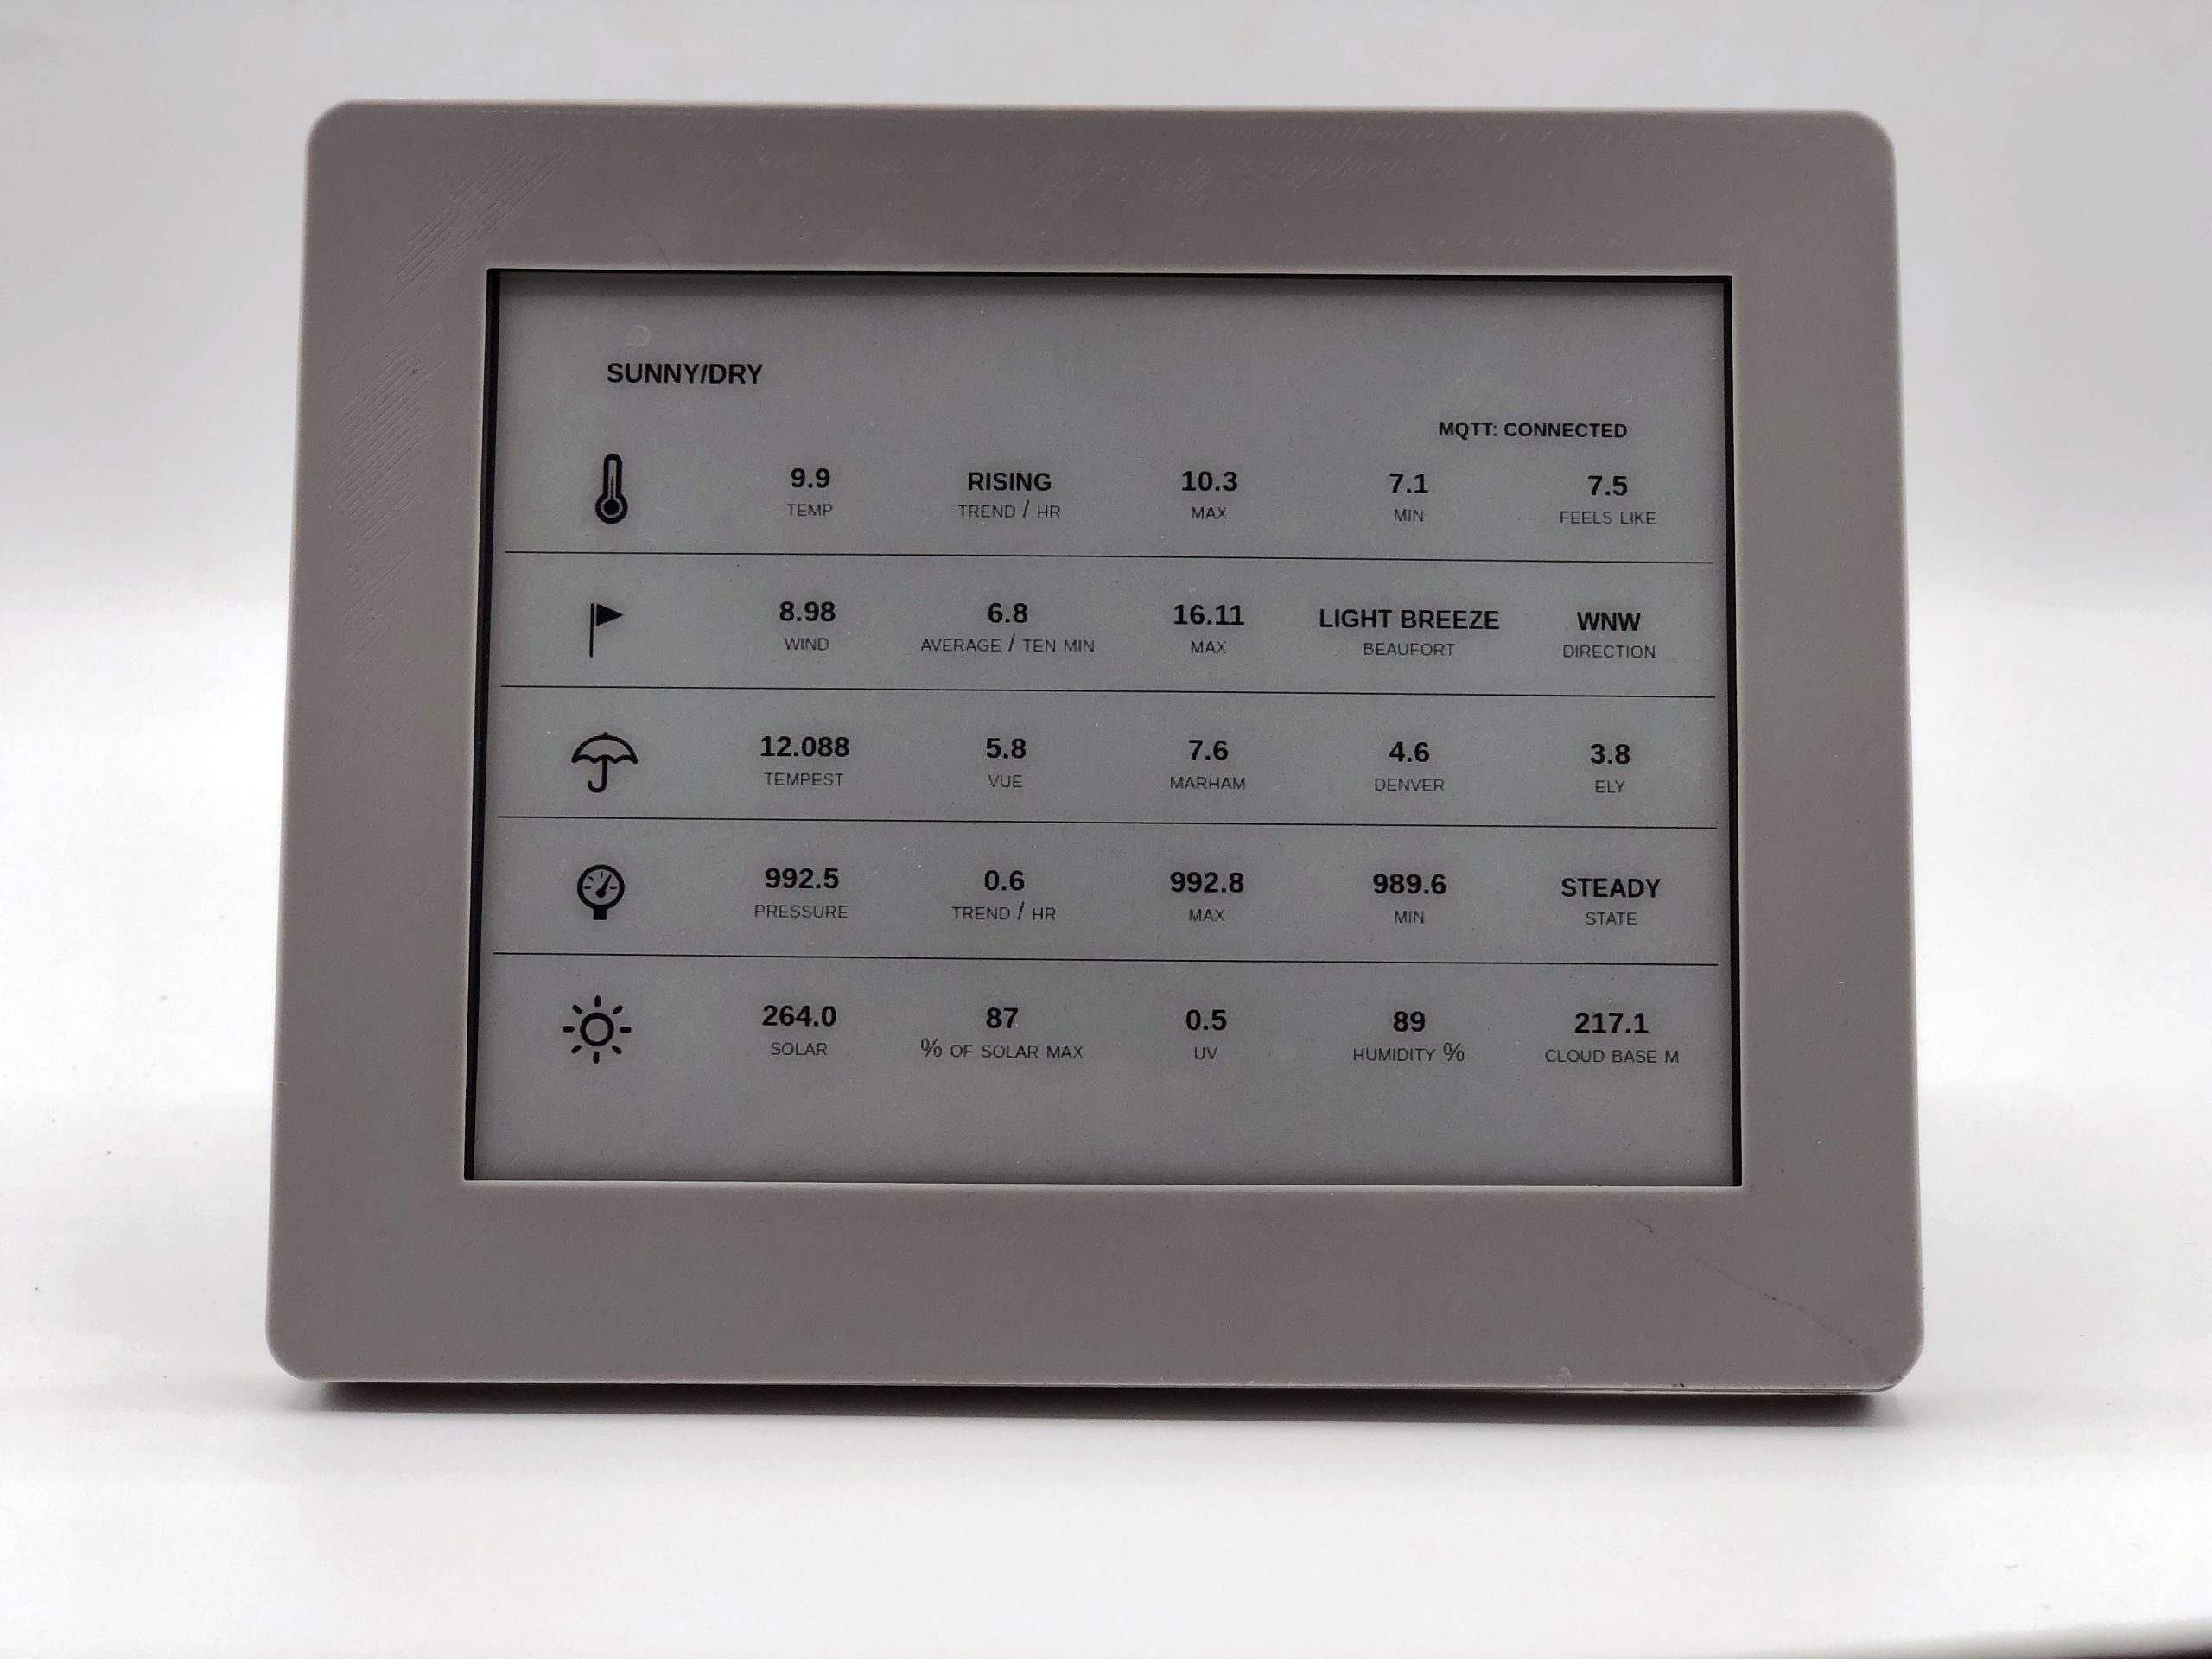
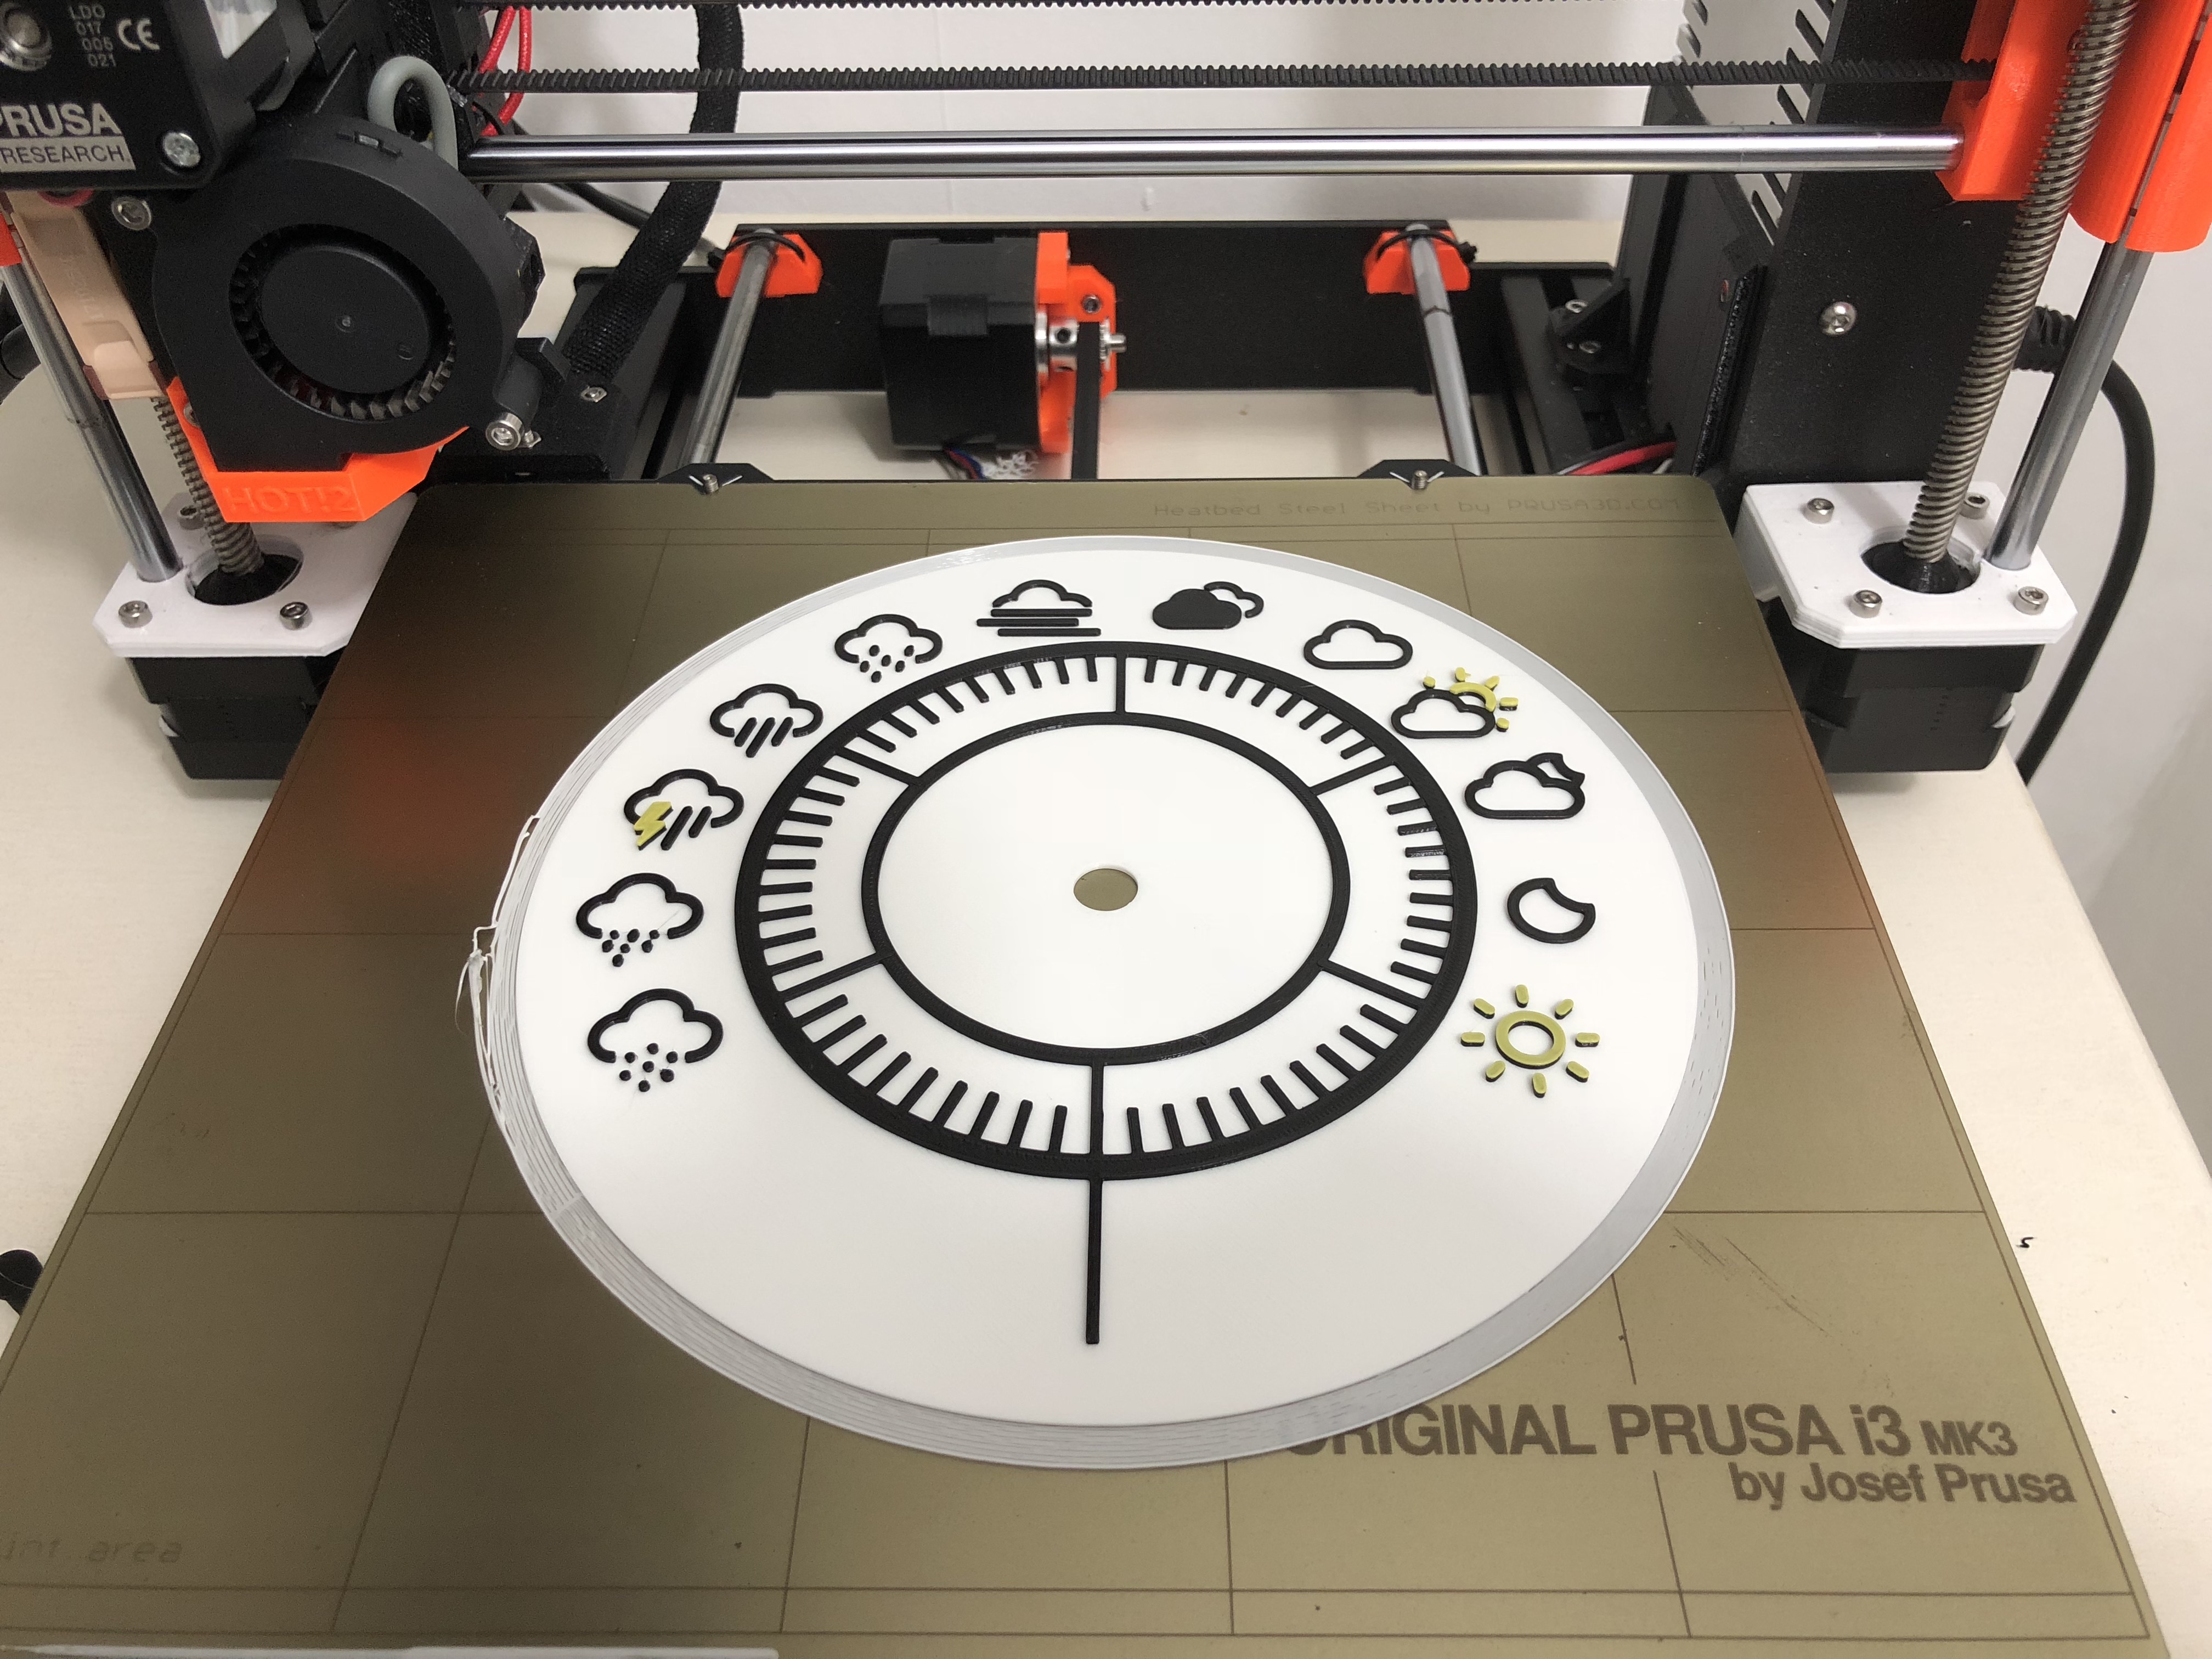
Personal Weather Stations are the first stop of Connected Environments – allowing the deployment of devices, collection of data from multiple sensors, online and augmented reality visualisation as well as the making of physical things via lights, servos and actuators to communicate the data. They act as a one stop shop for multiple methods of data collection, analysis and visualisation around Connected Environments.

Partners

UCL, London Legacy Development Corporation


Quick Facts

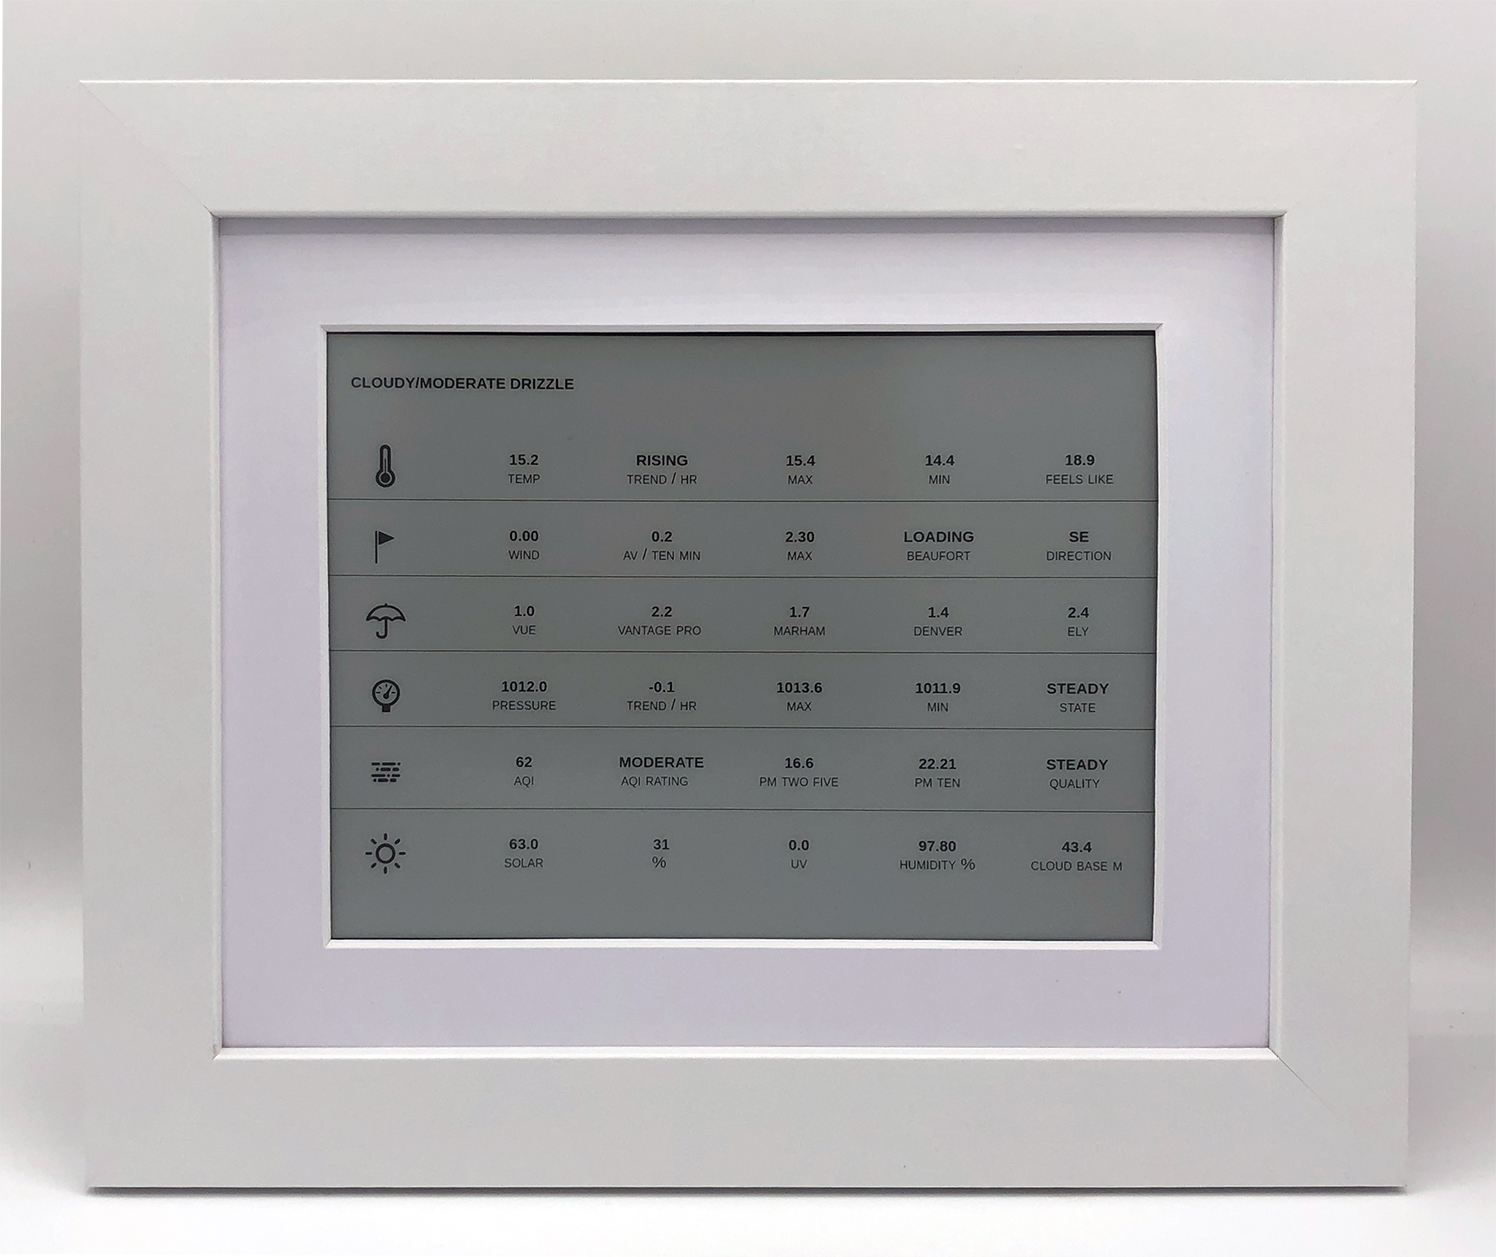
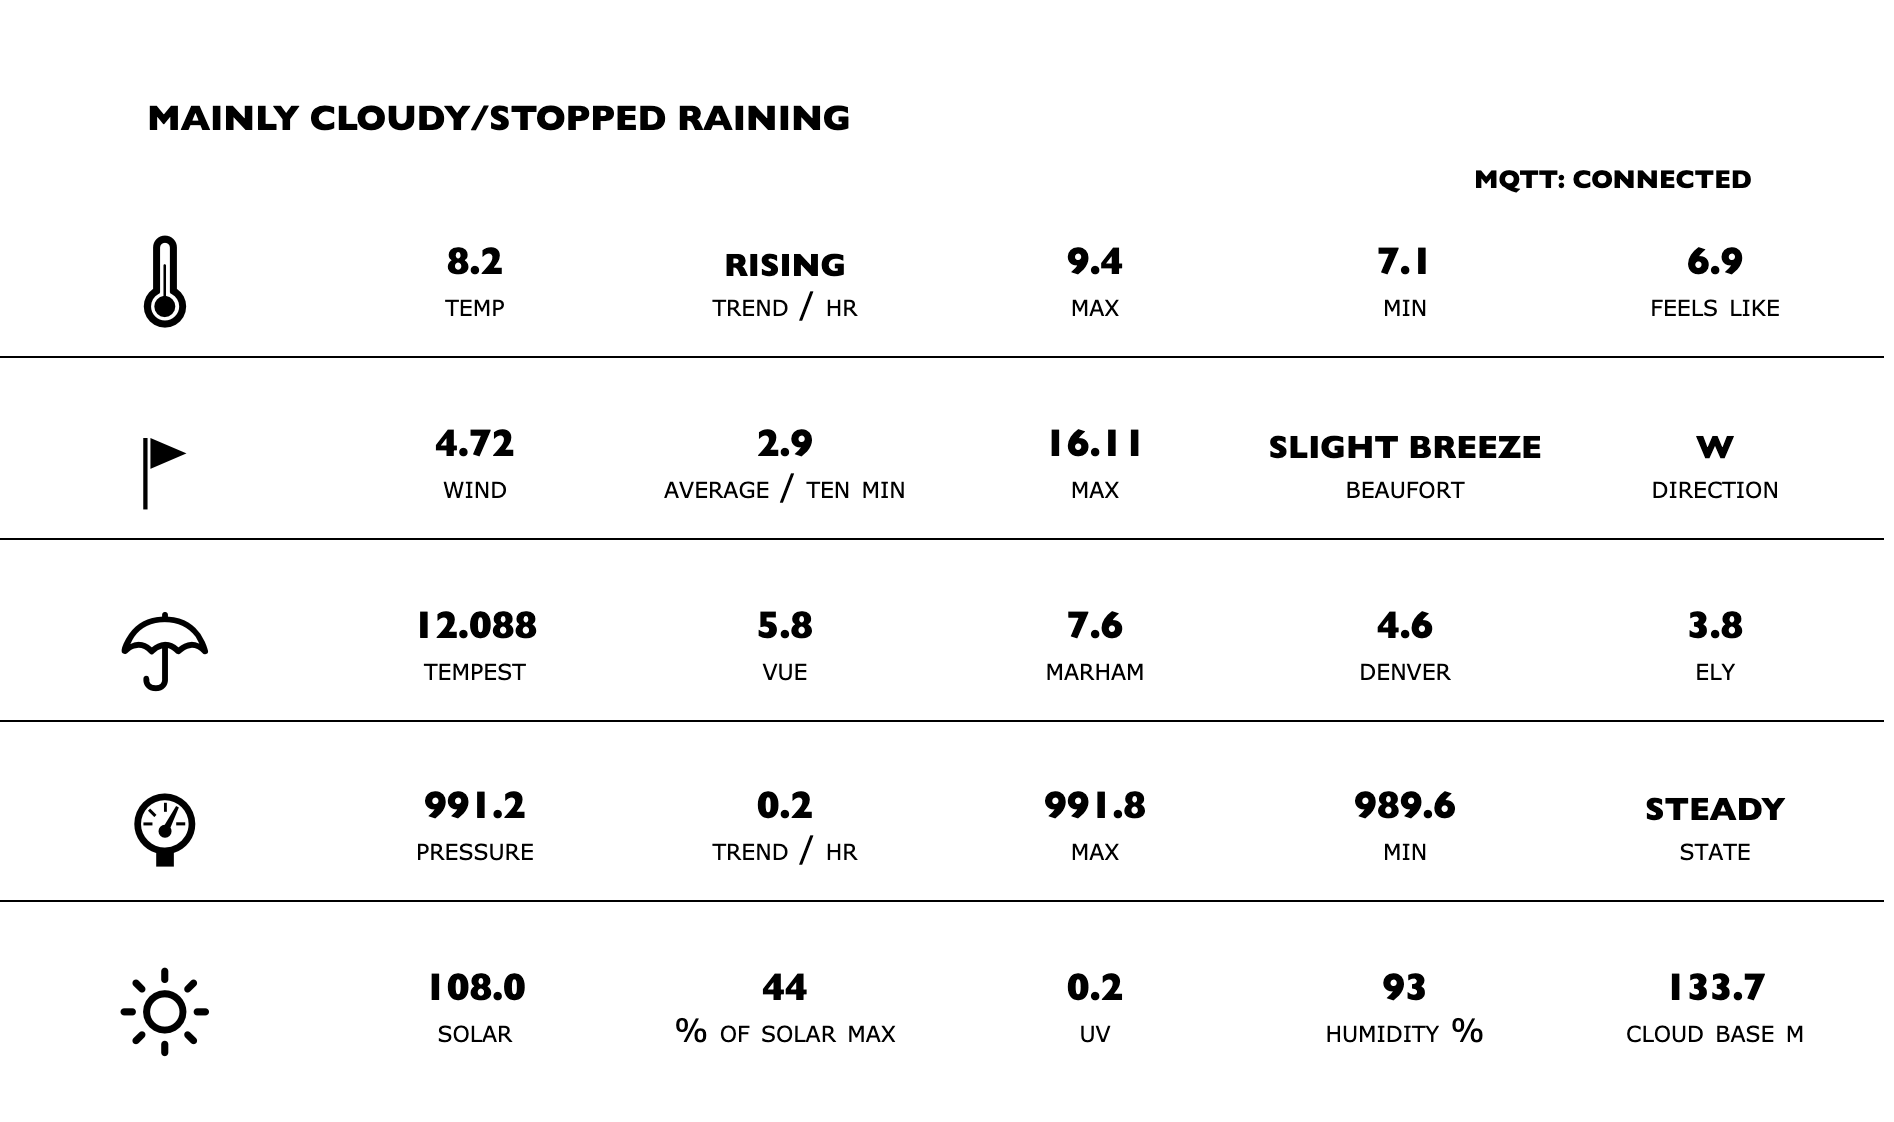
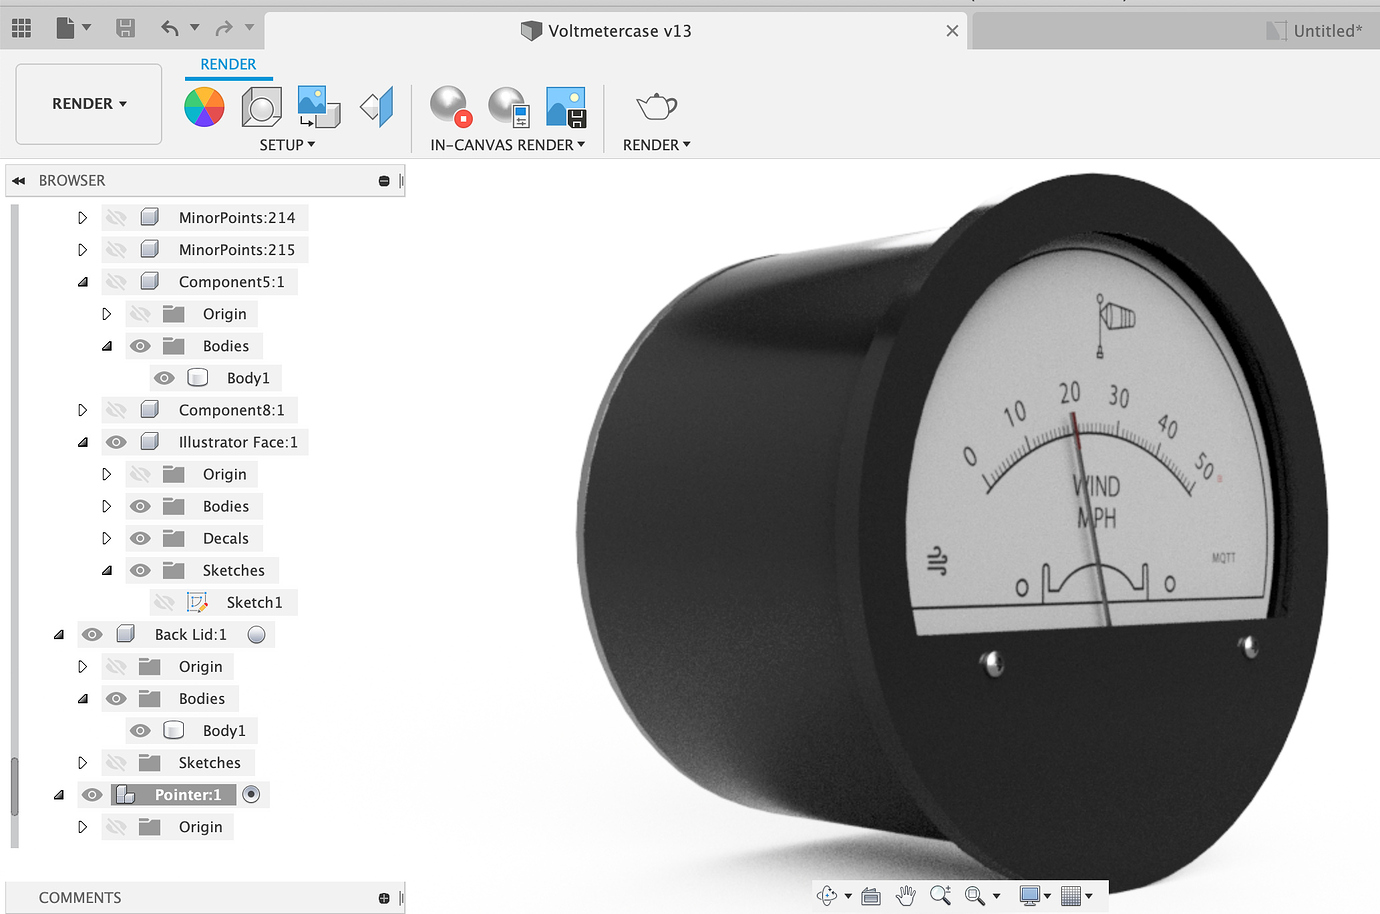
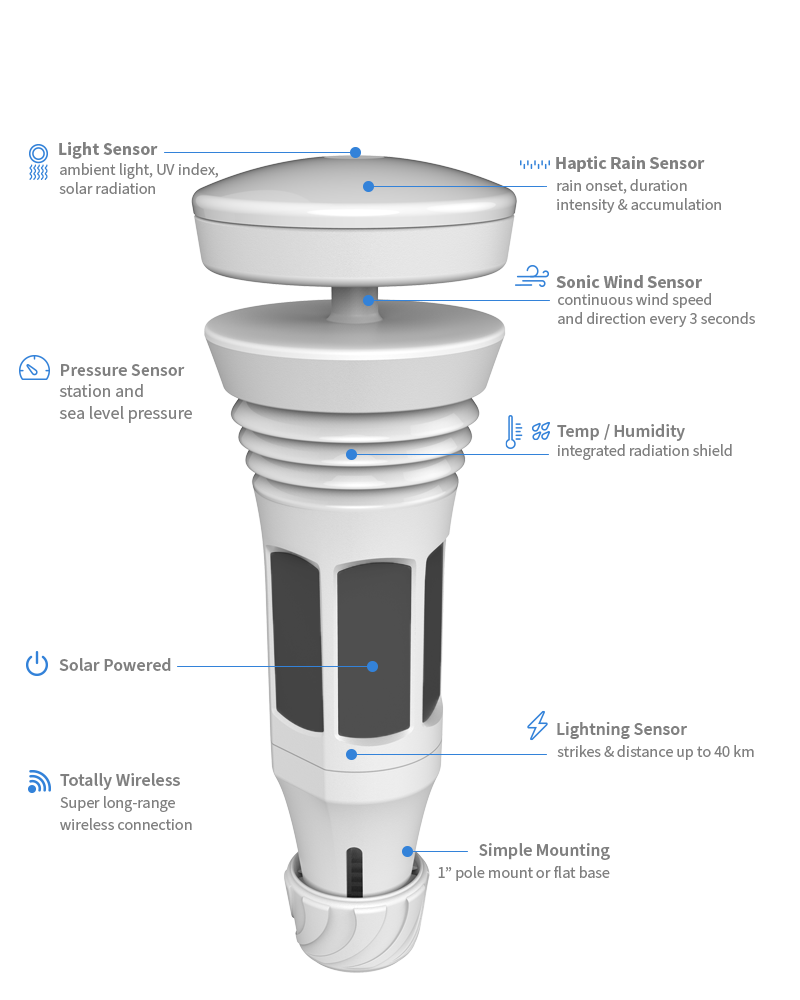
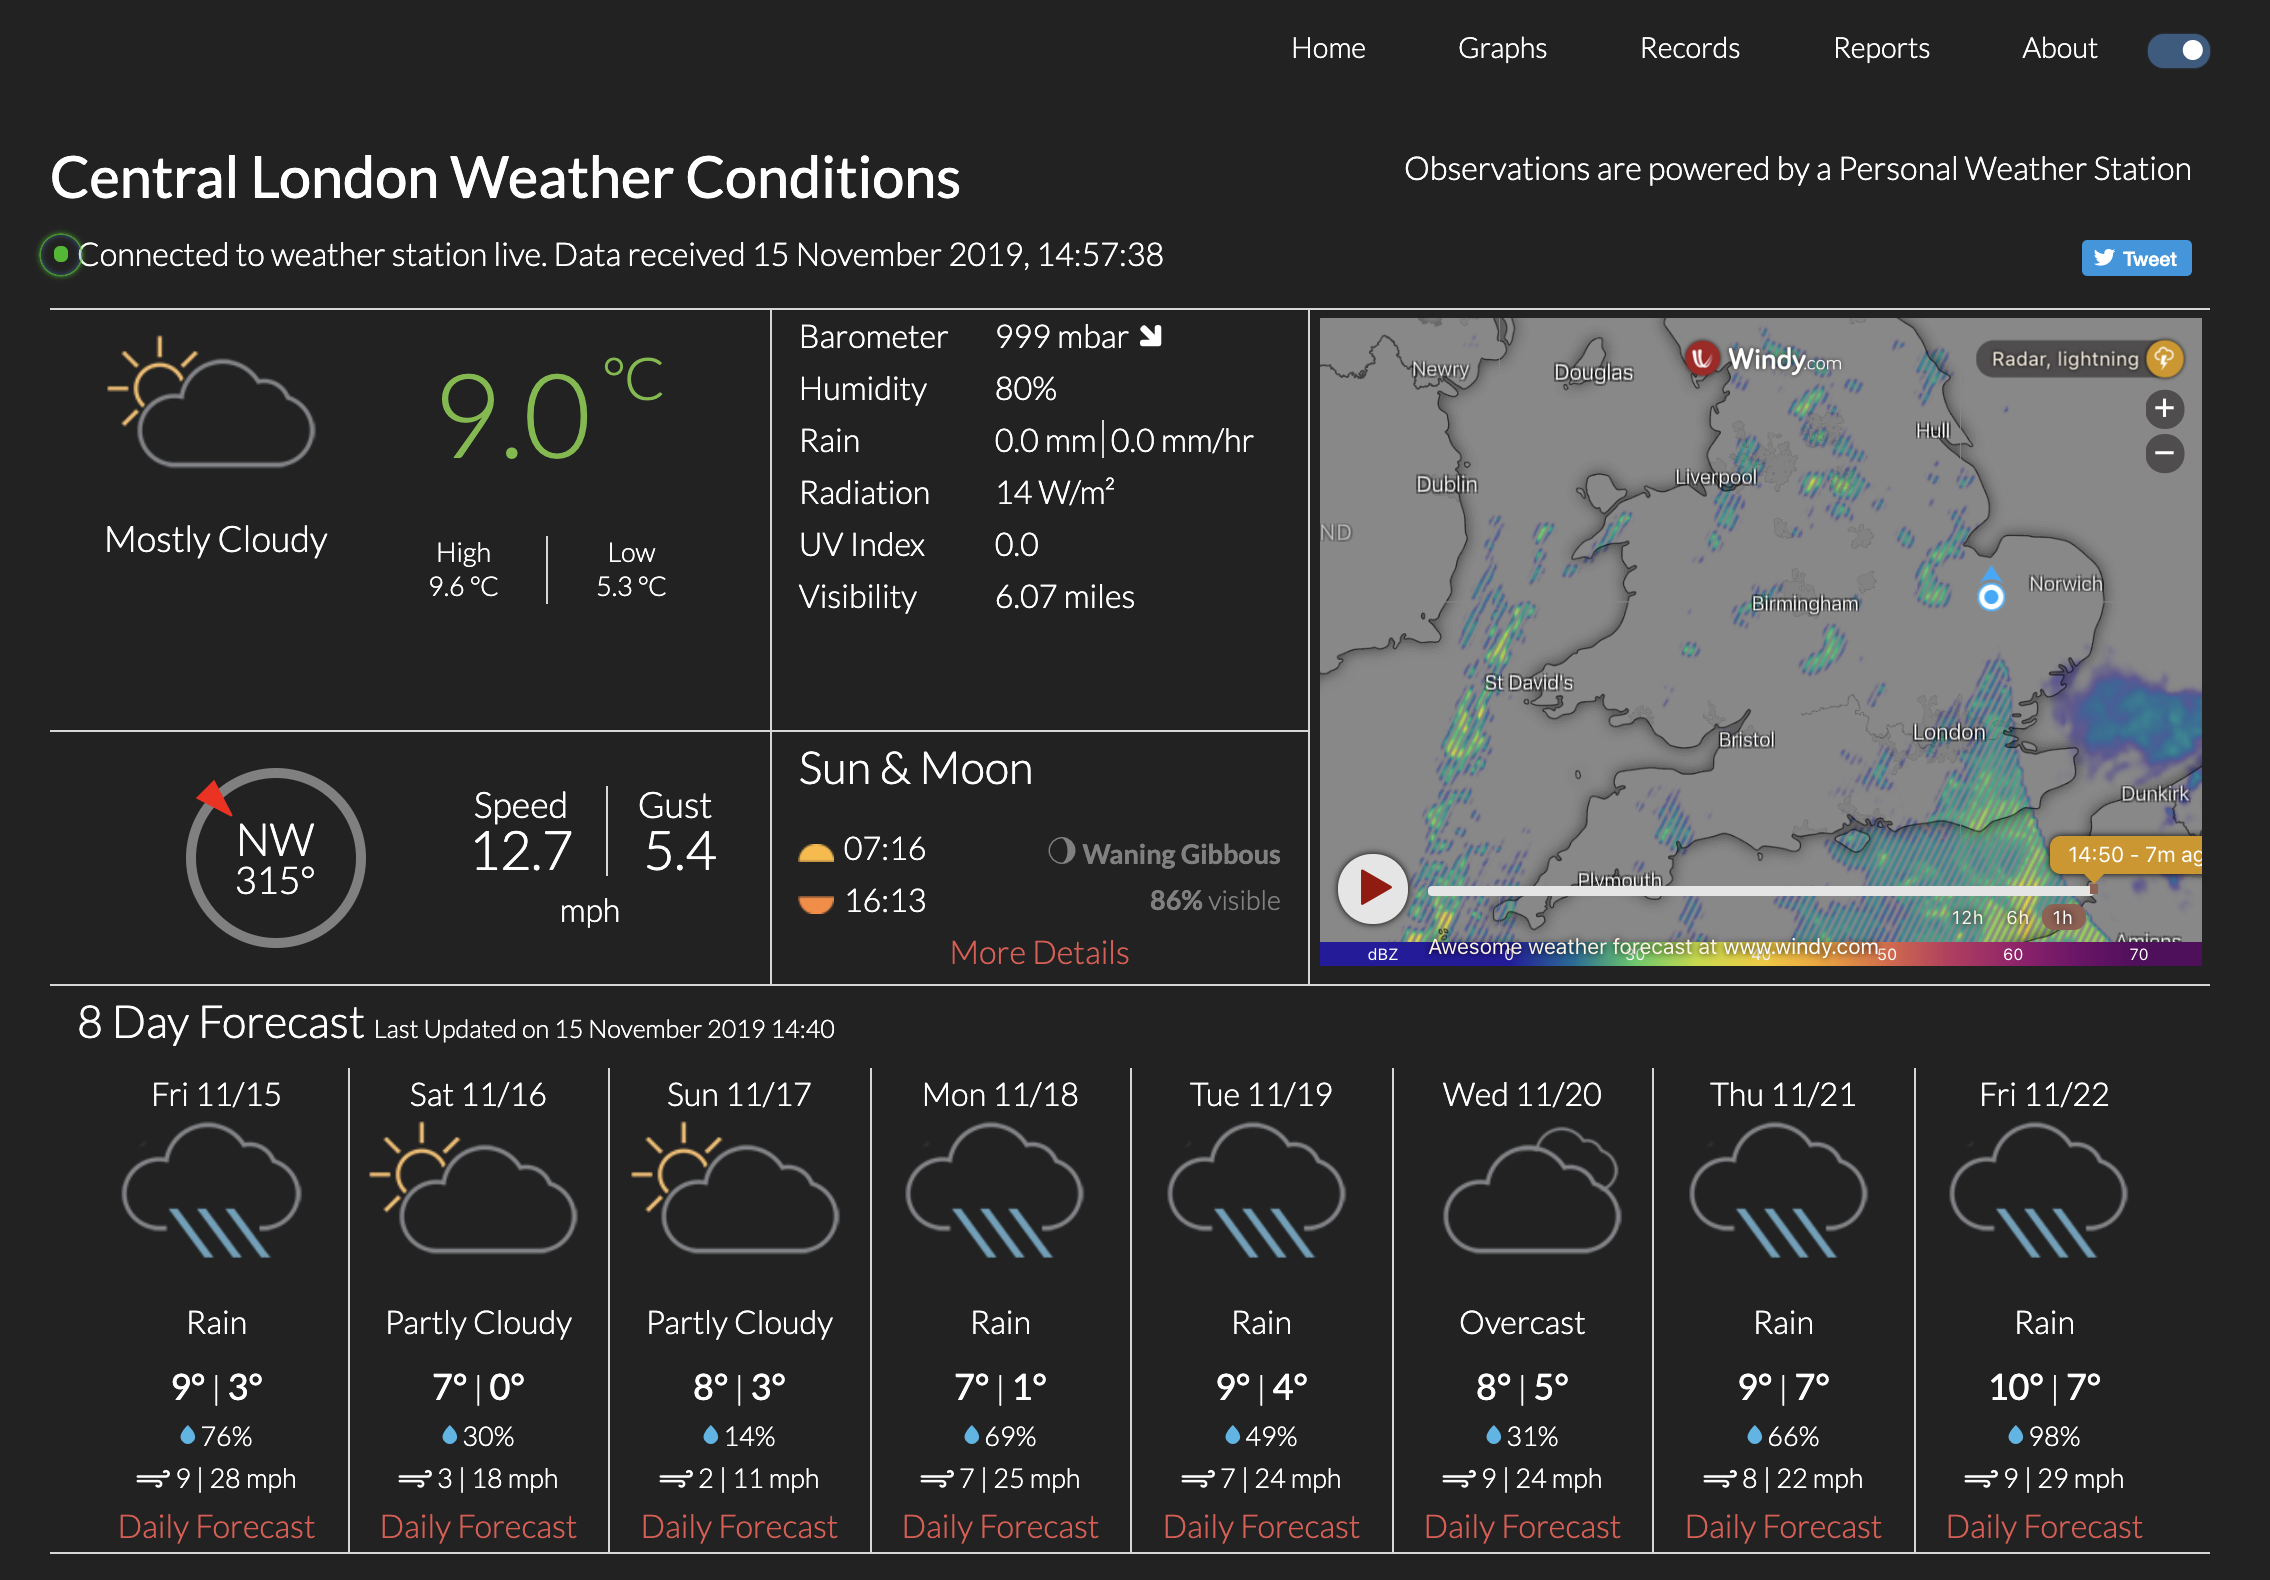
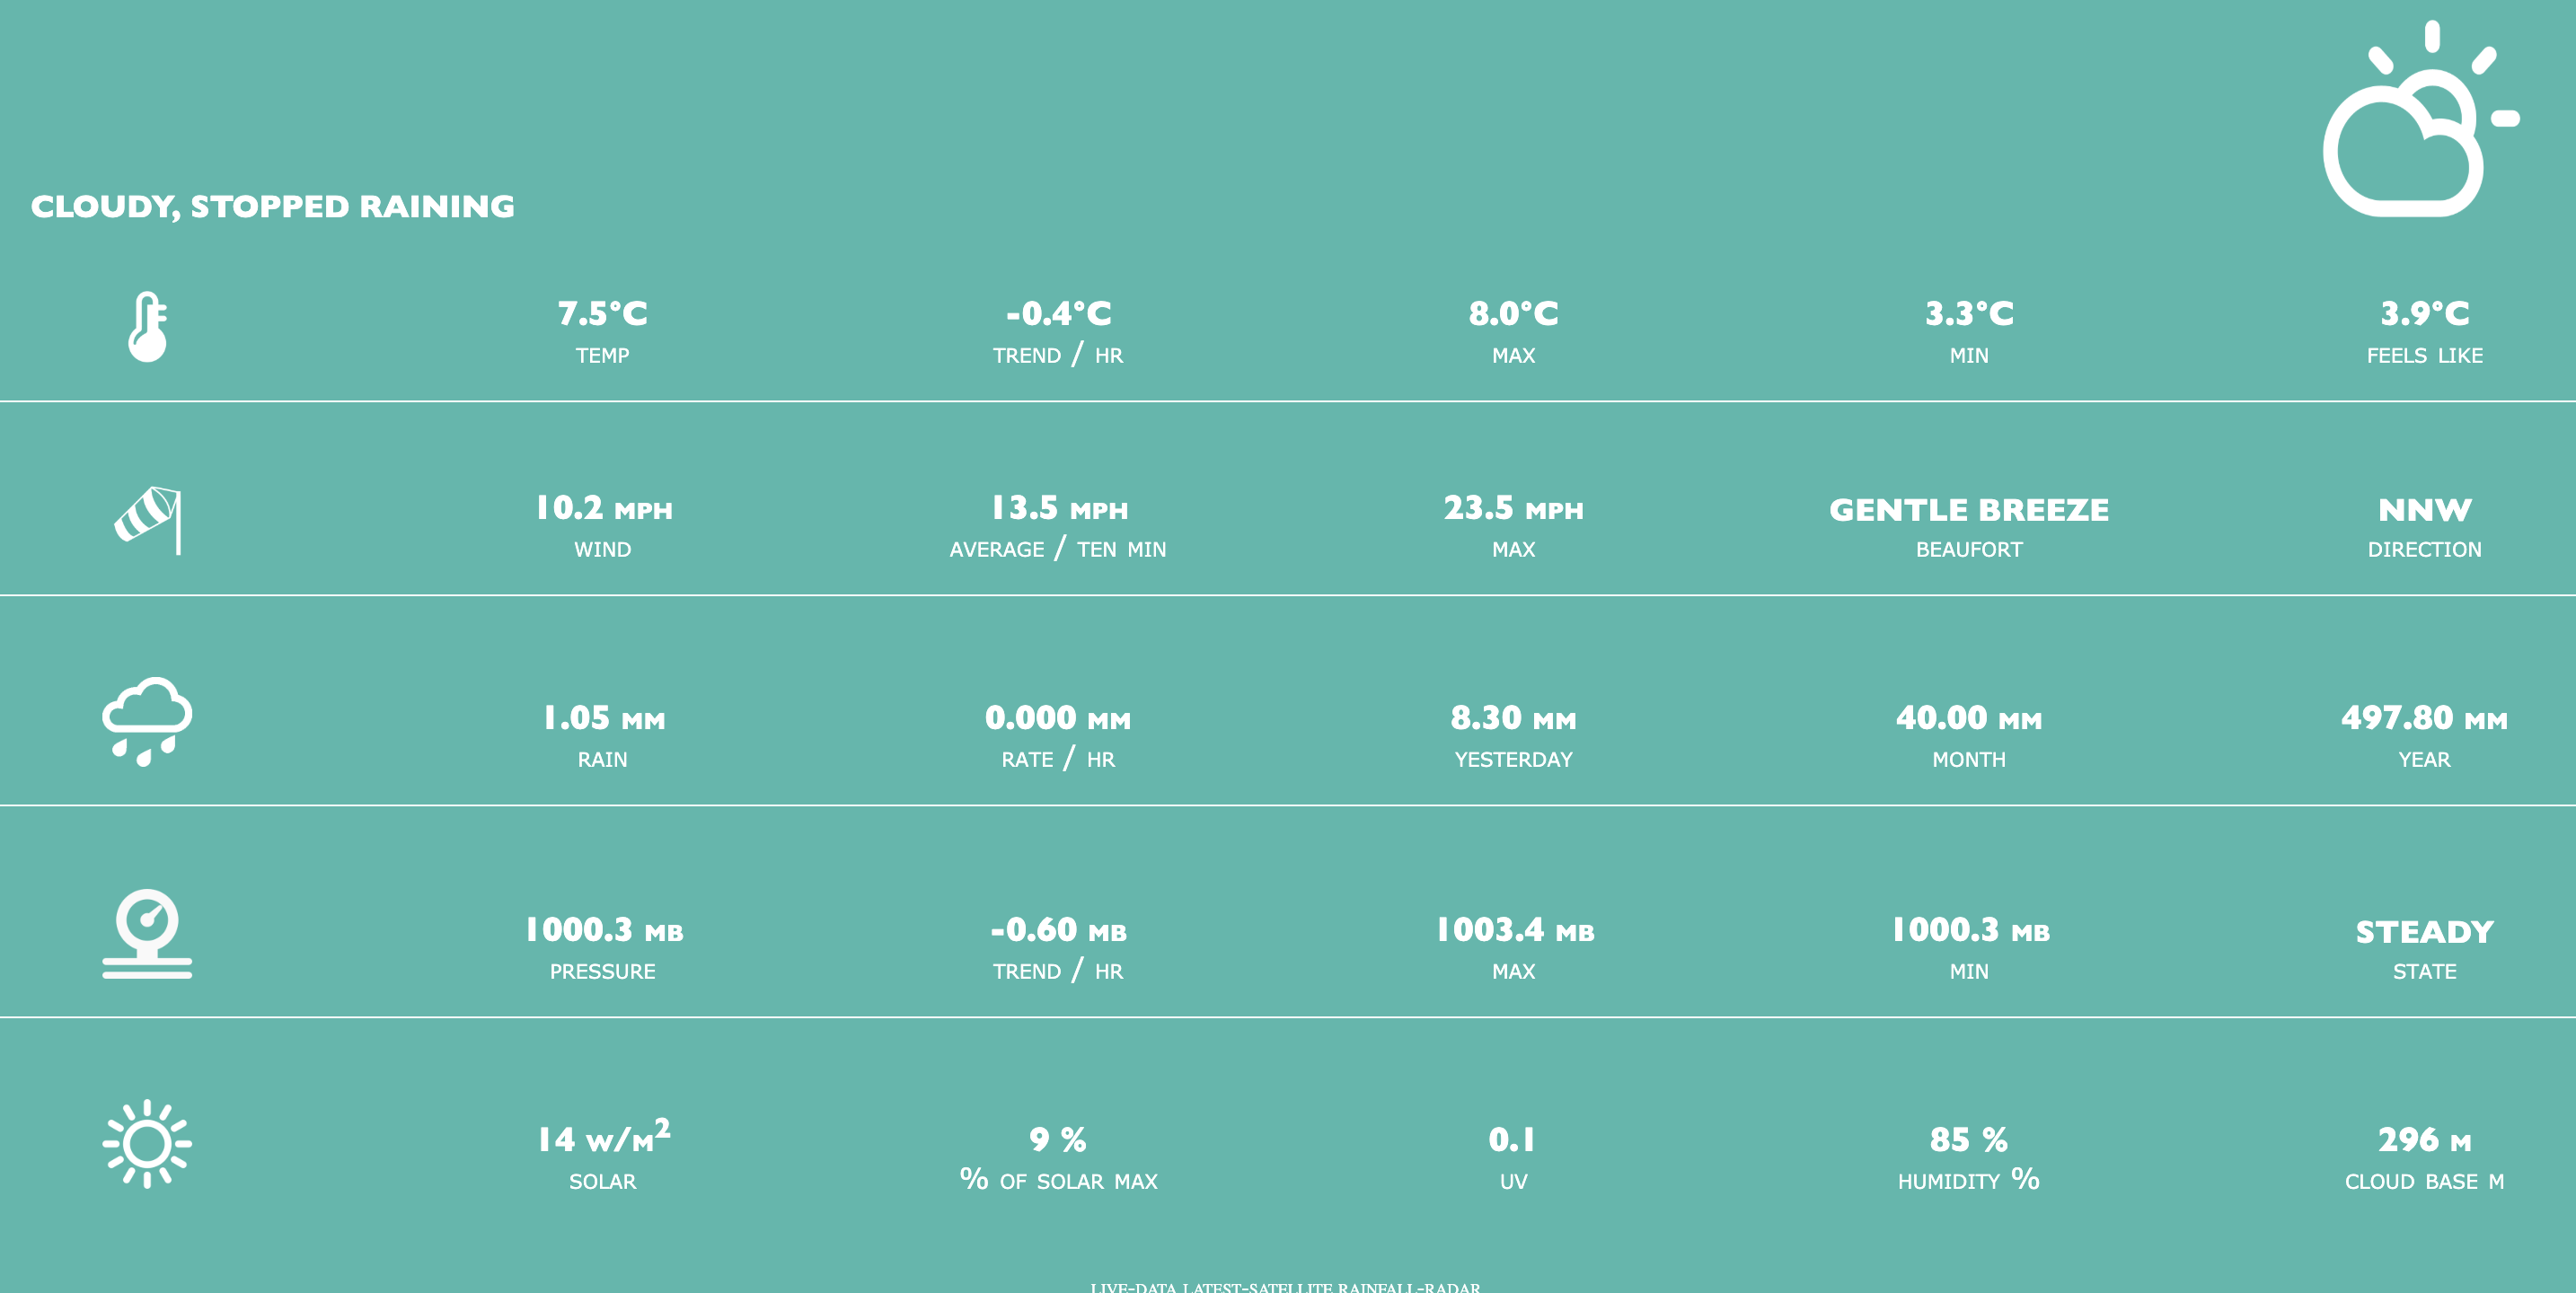
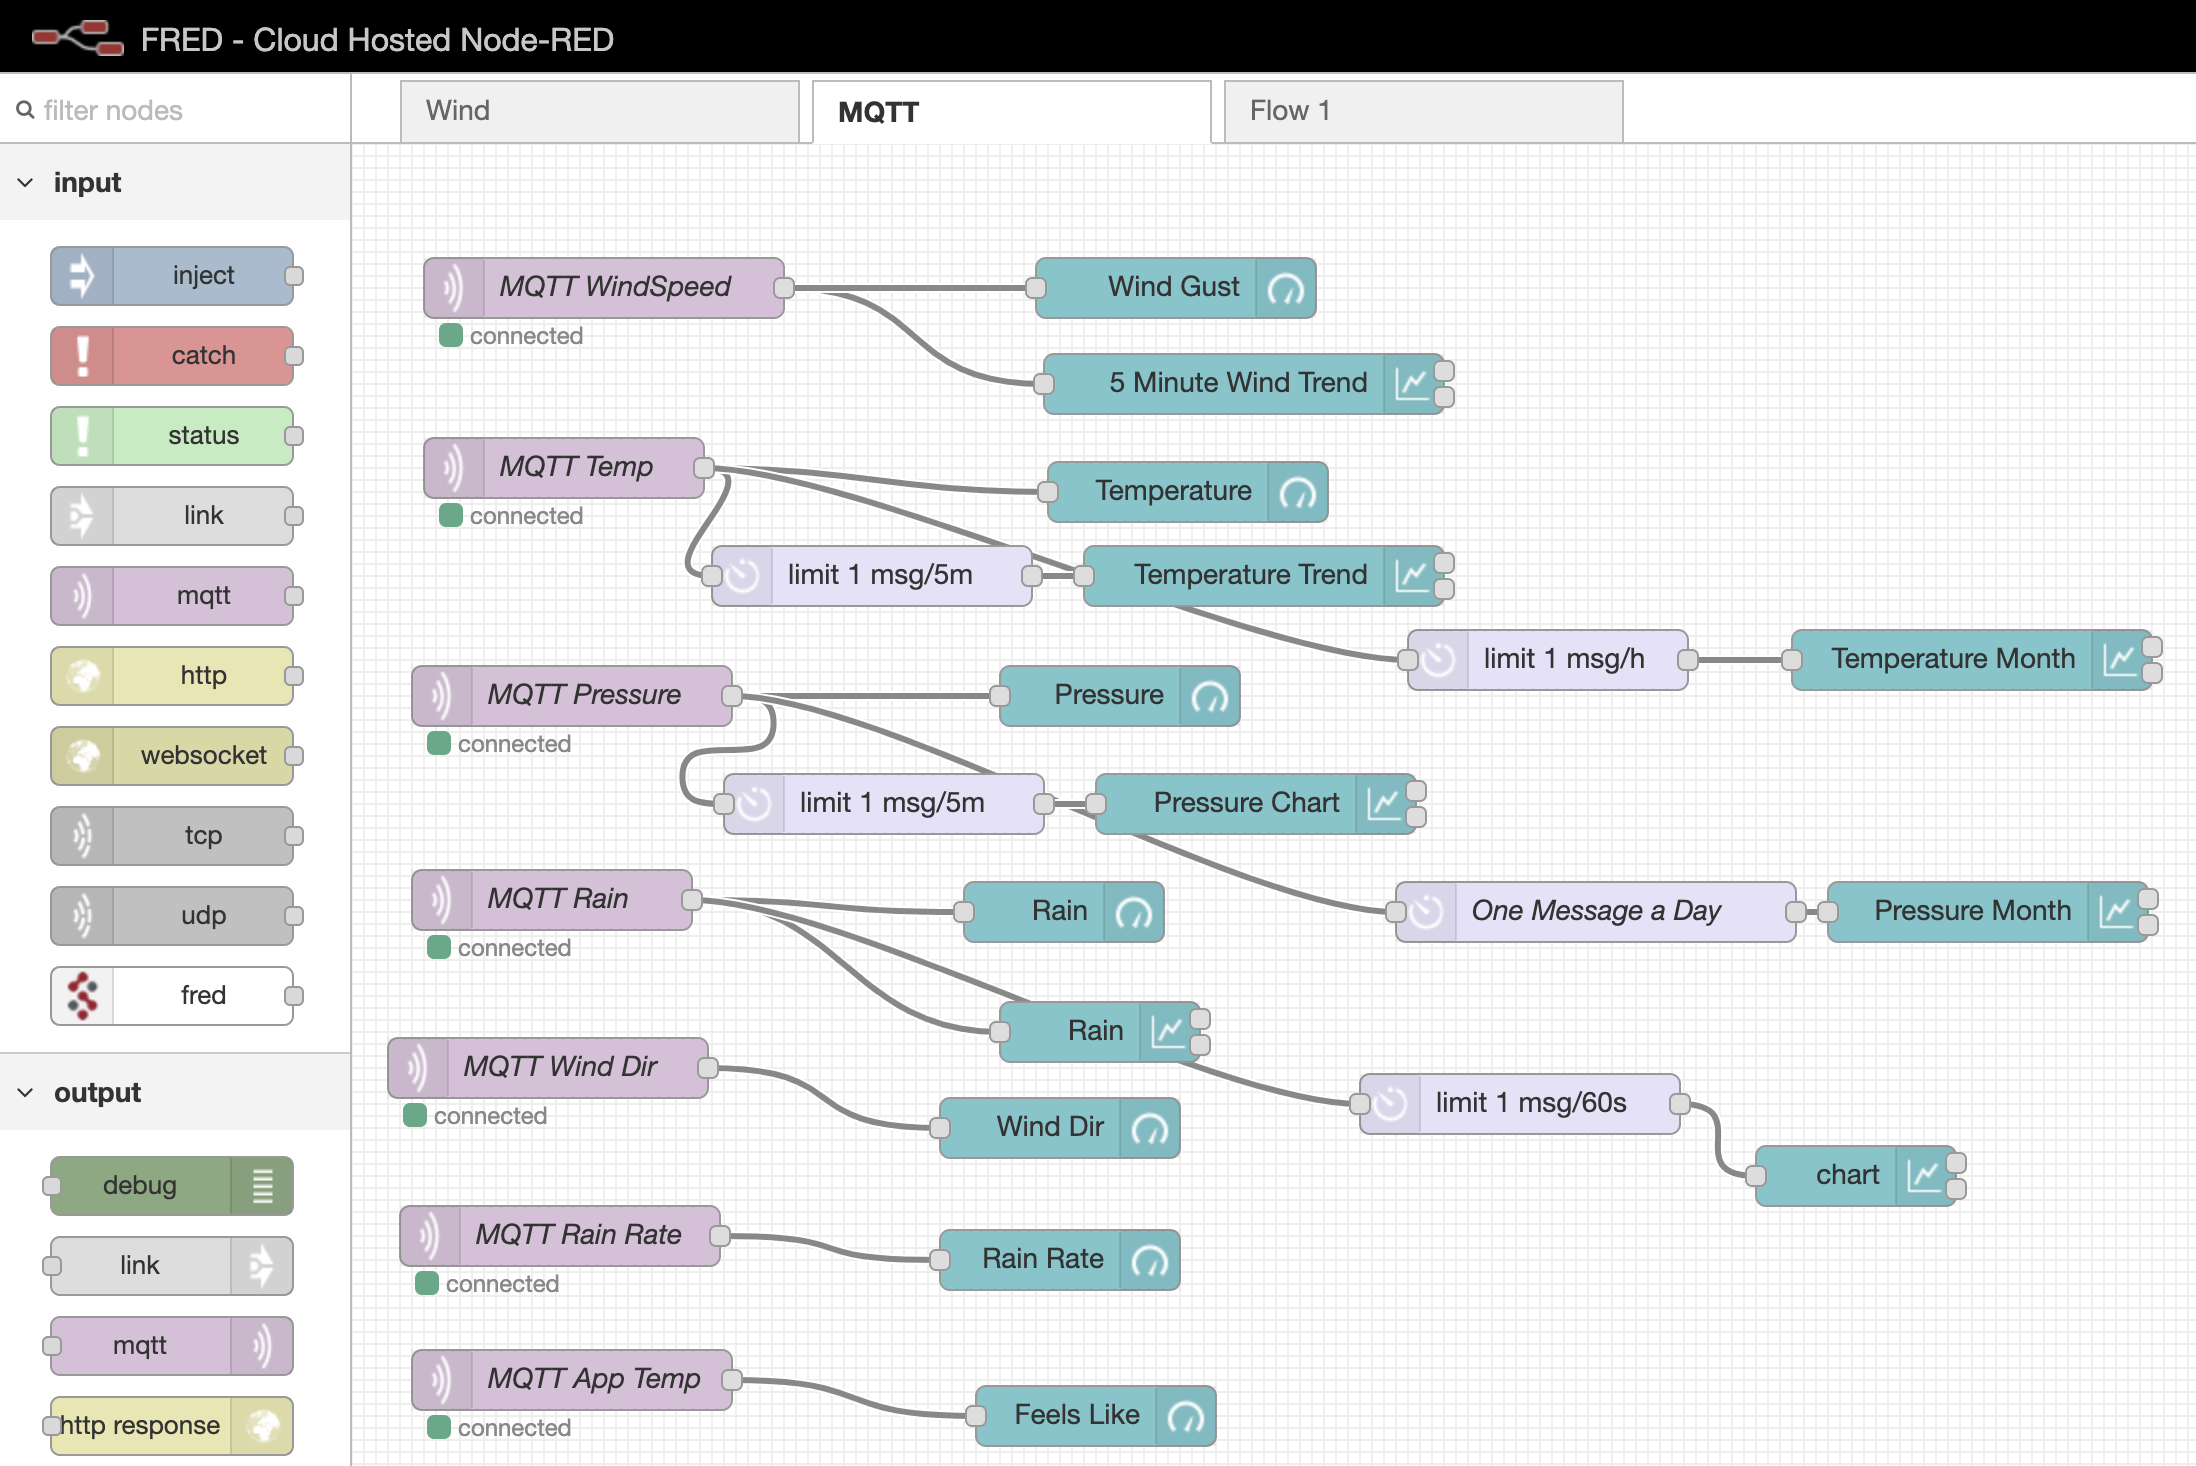
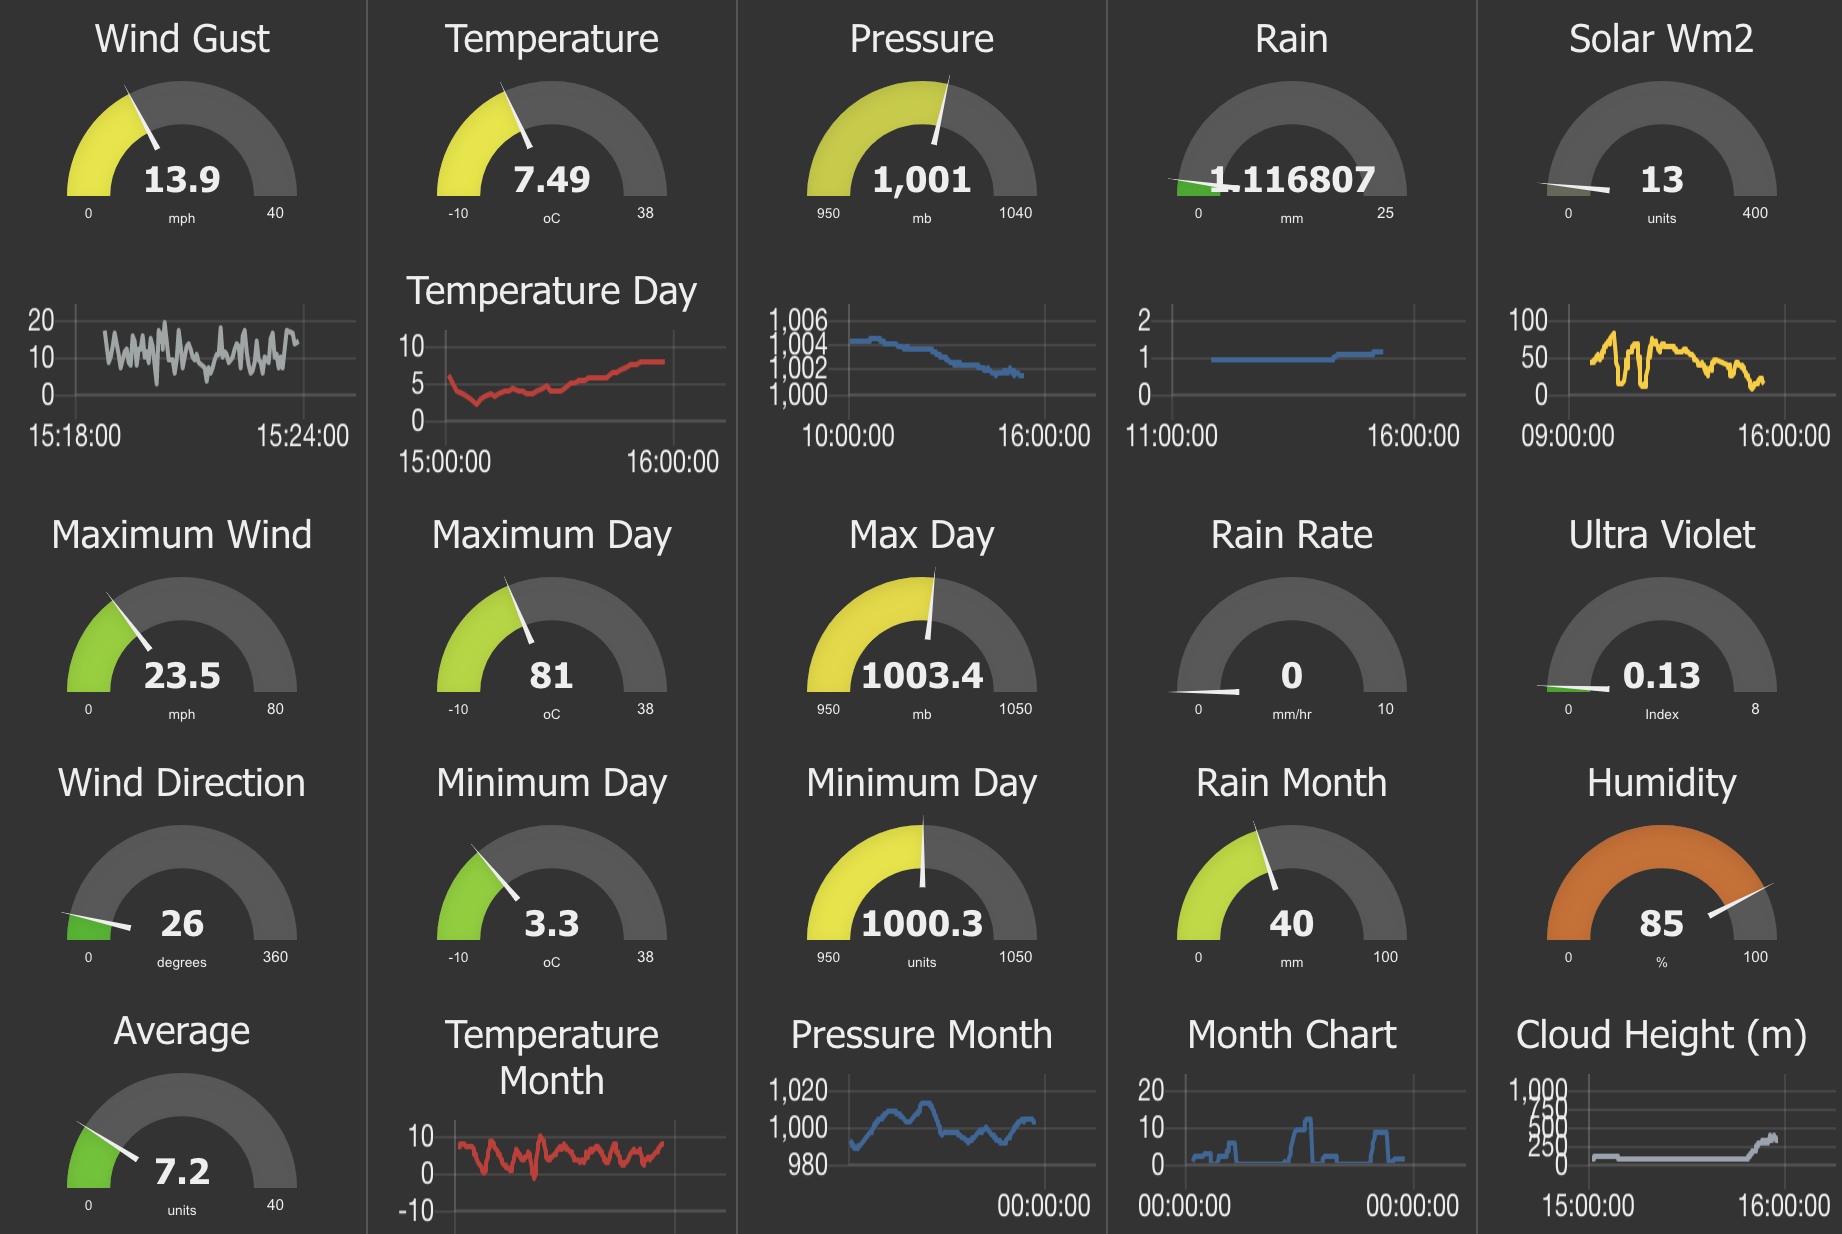
Data from our weather station deployments update every 3 seconds via Message Queue Telemetry Transport (MQTT) – a lightweight messaging protocol for small sensors and mobile devices, optimized for high-latency or unreliable networks.

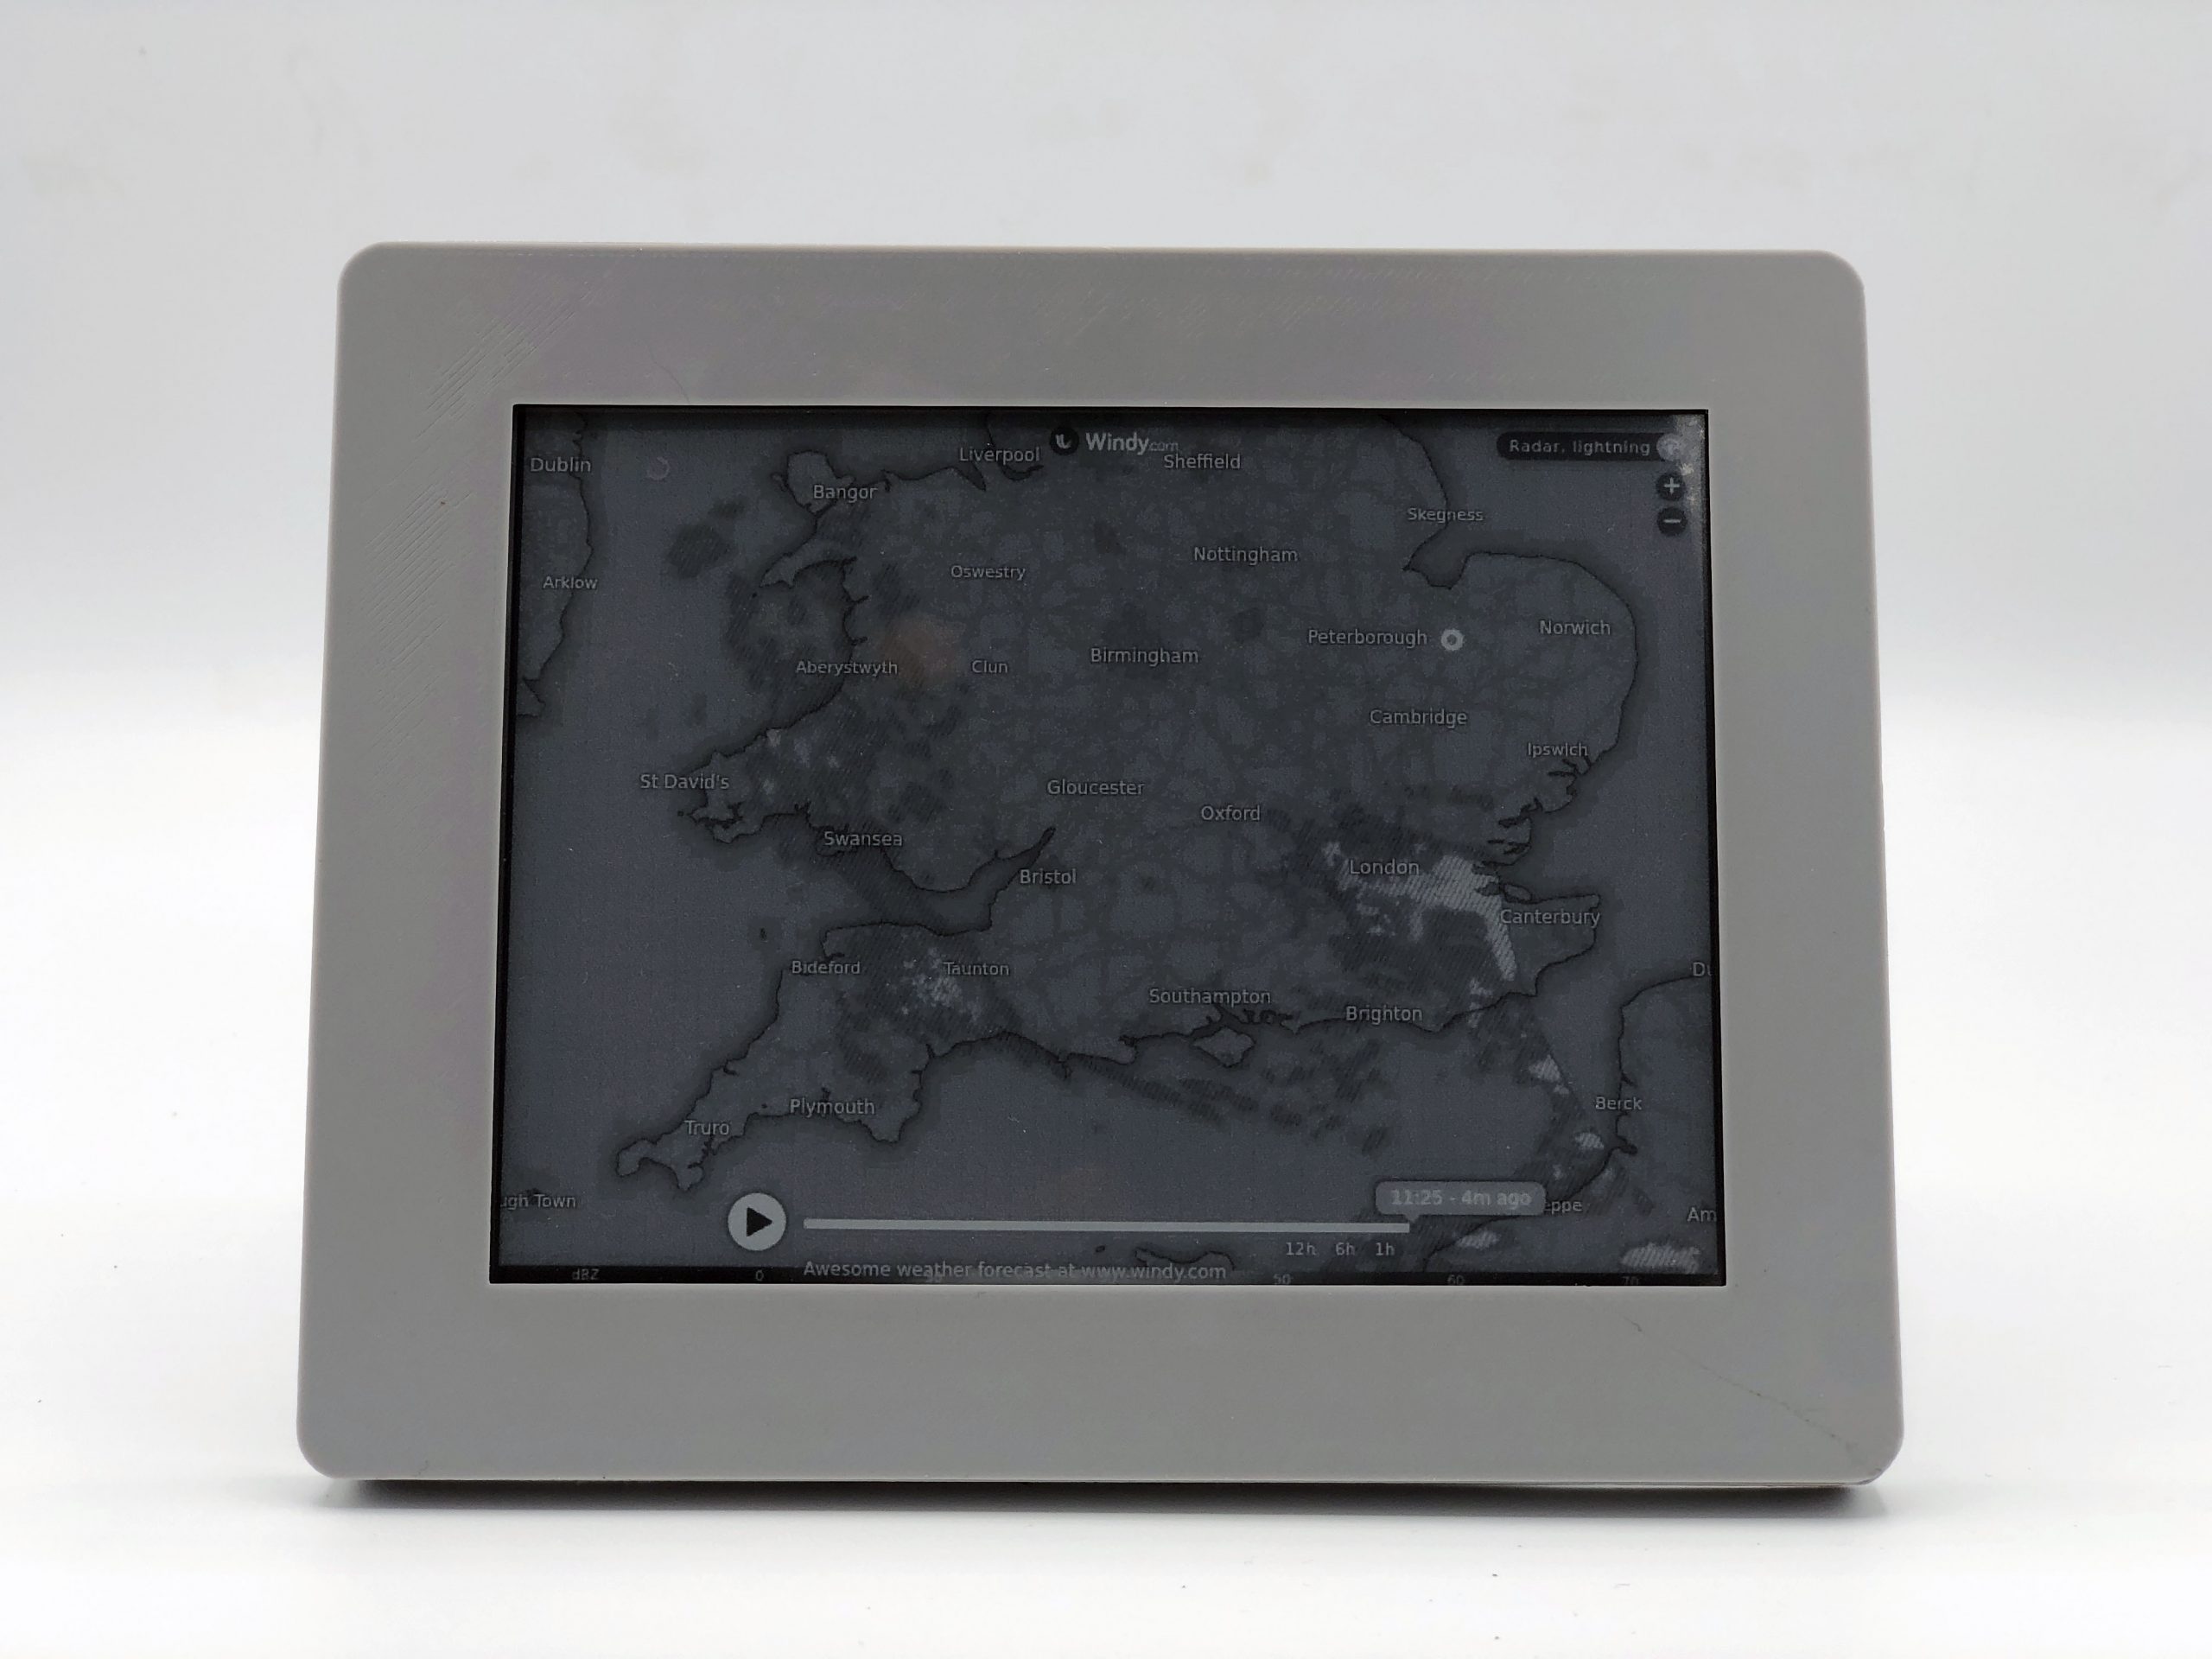
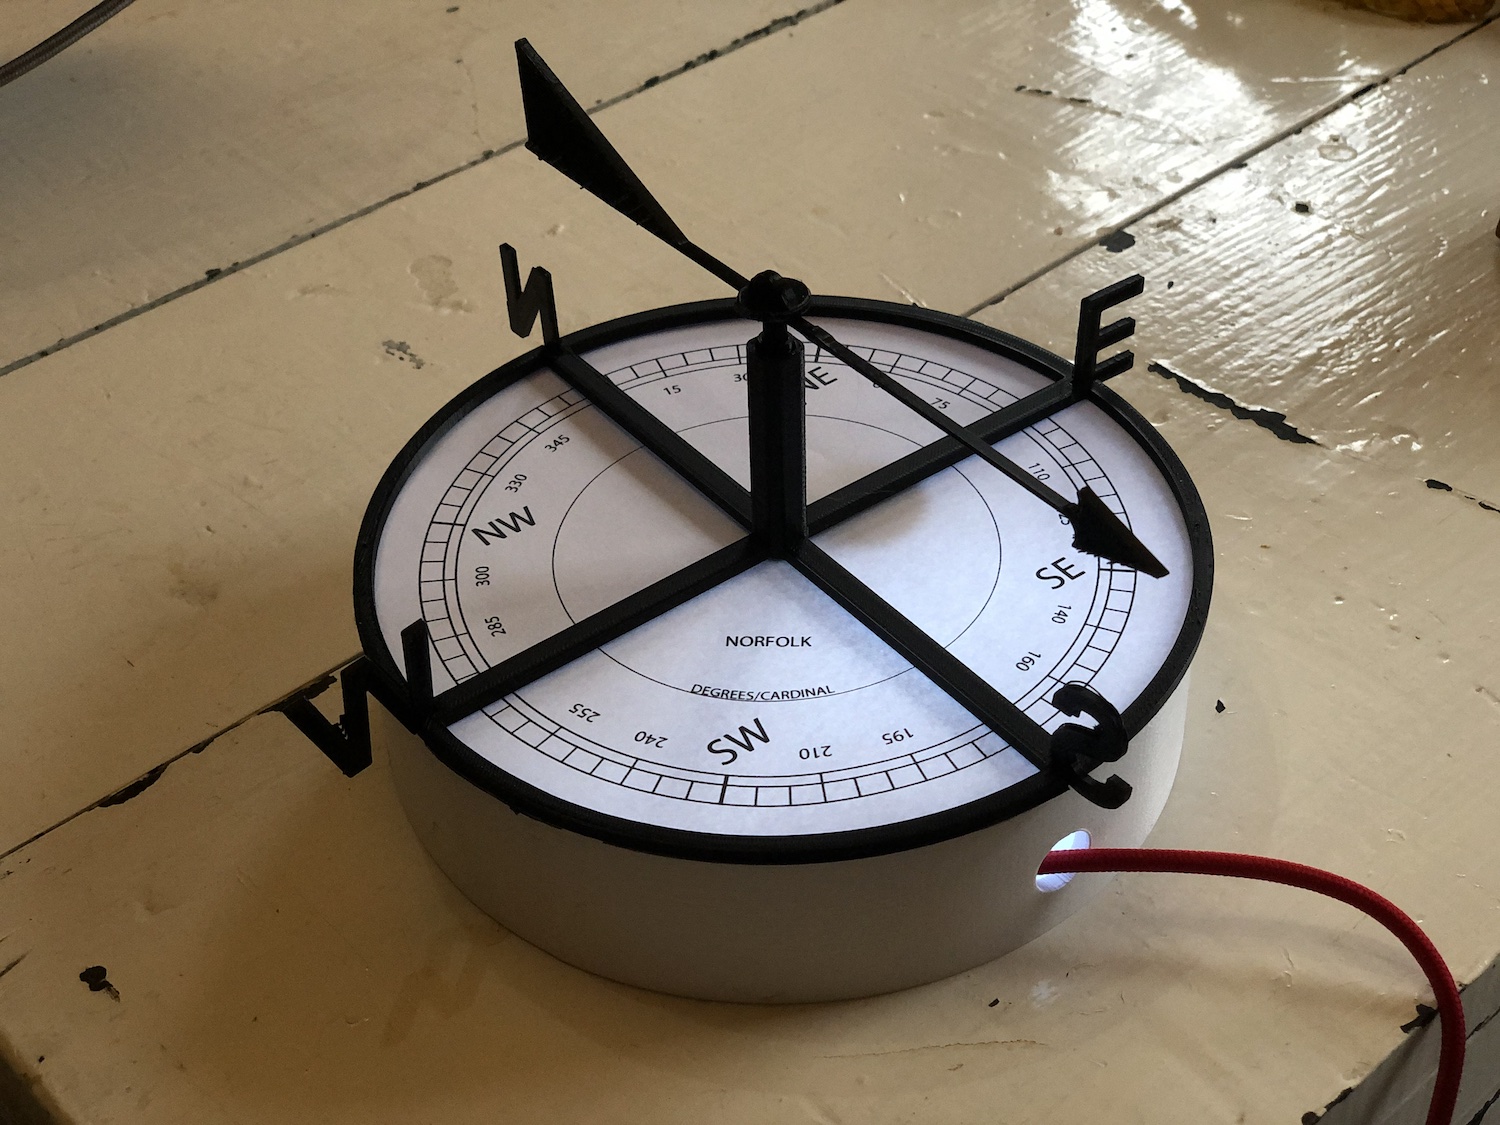
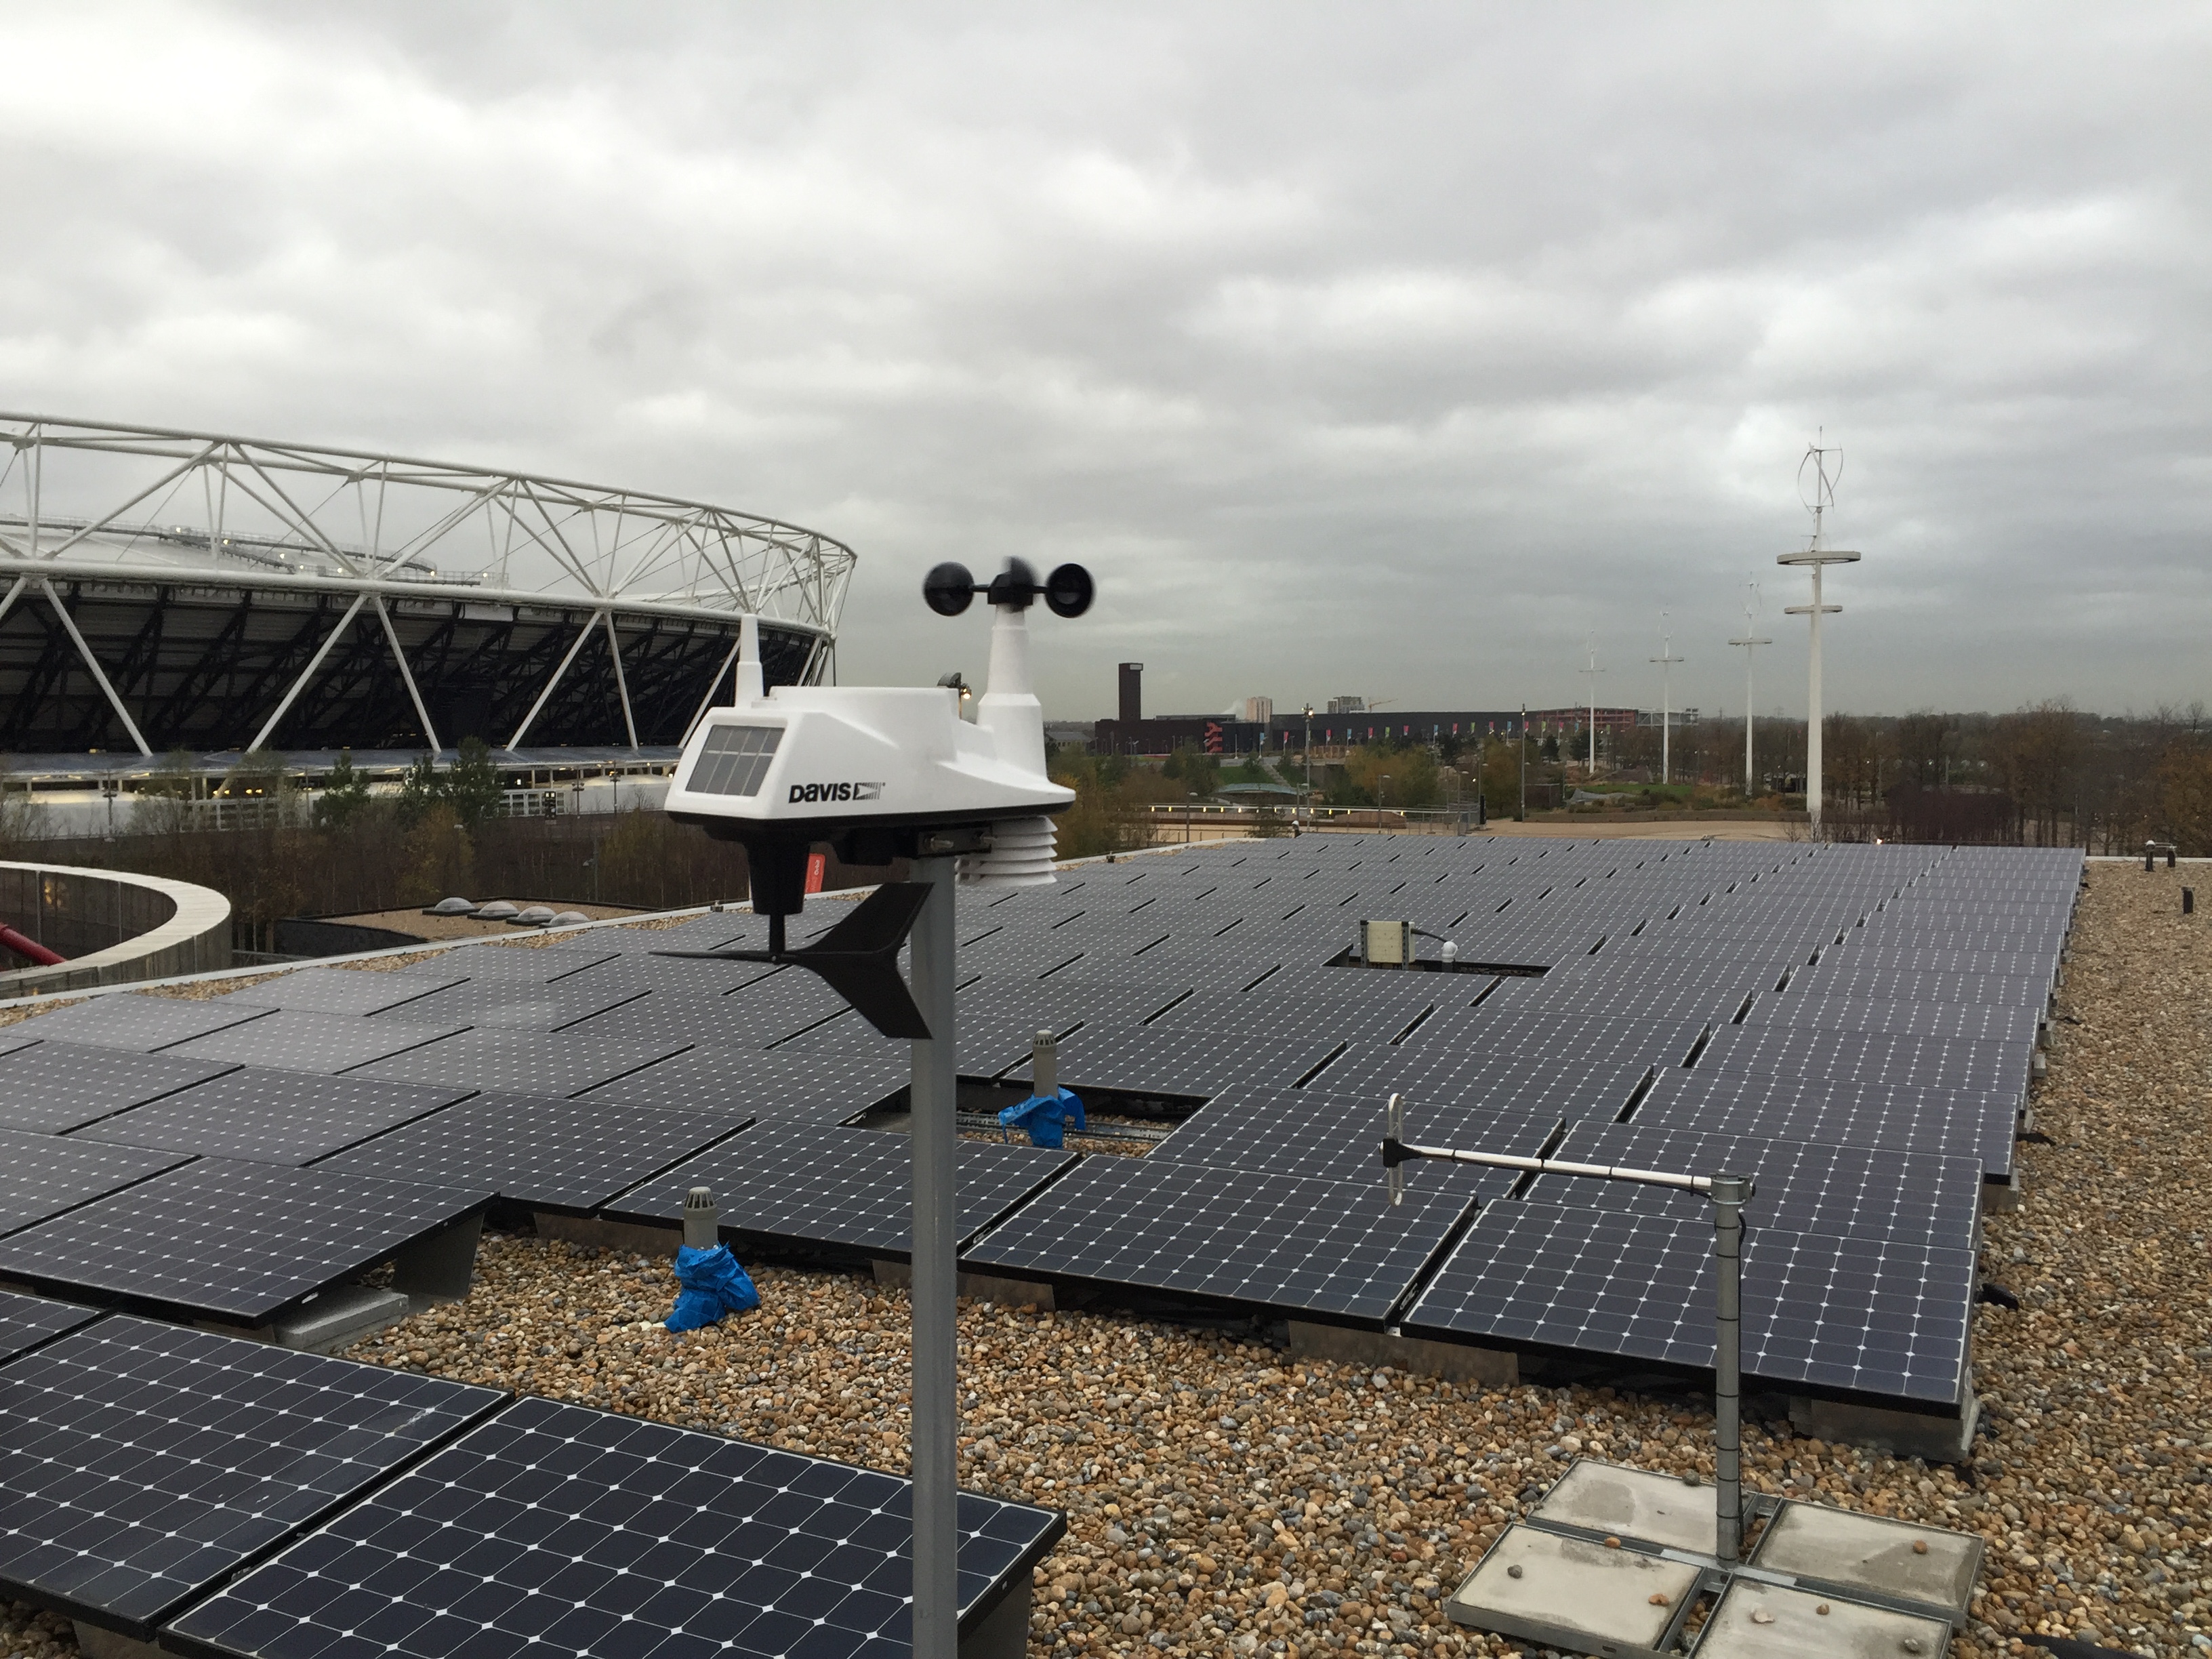
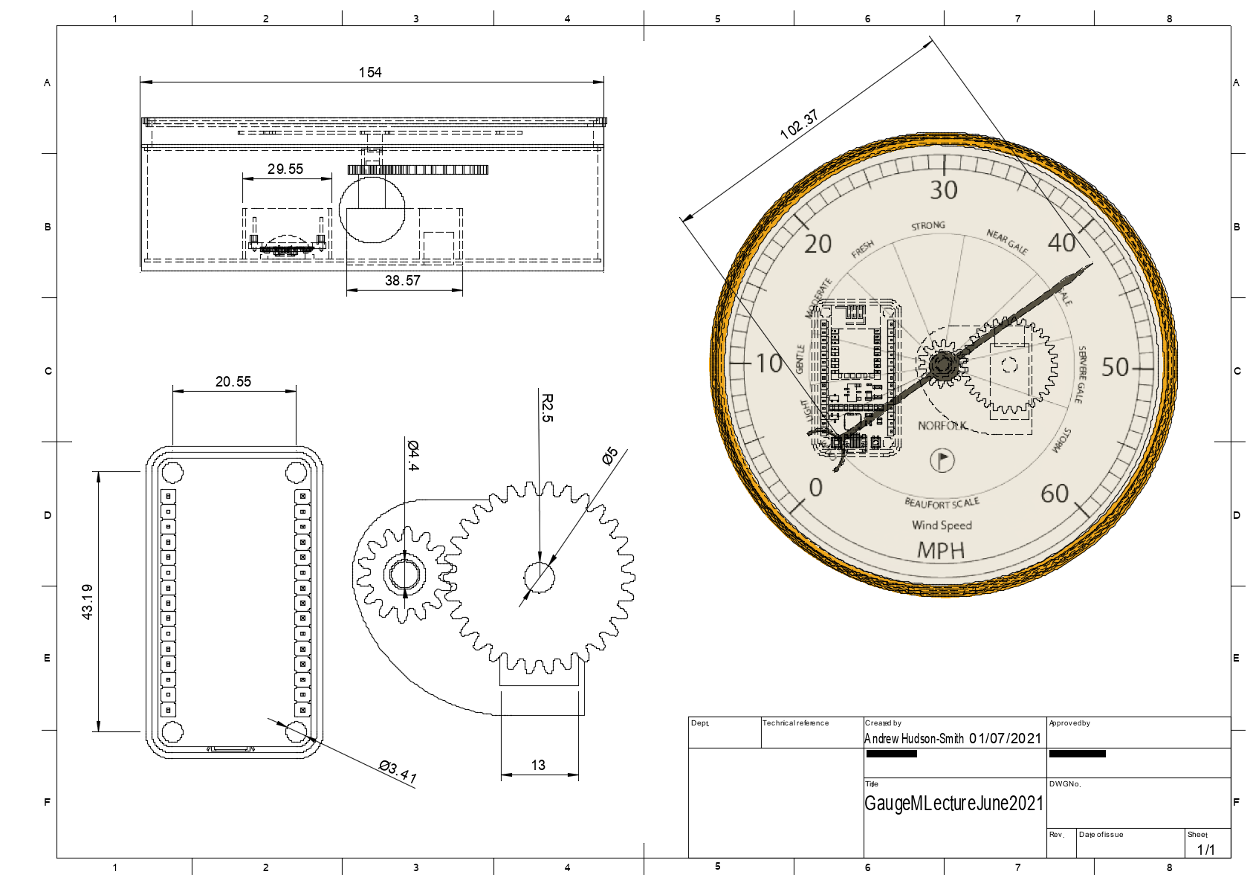
We have three live stations – two in London, one at UCL and the other at the Queen Elizabeth Olympic Park, and one in Norfolk to explore rural data communication. More are planned…

The Connected Environments team currently run weather stations at 3 sites with 3 different types of weather station hardware sending data into our network. Weather stations make a perfect starting point for exploring real time data, allowing data to be collected from off the shelf systems and used to explore and build data visualisation and analysis techniques.

From opensource software such as WeeWX linked to a Raspberry Pi through to one off paid solutions such as Weather Display on a PC there are multiple methods for connecting weather stations to digital devices. We use weather stations from both Davis (Vantage Pro 2 and Vantage Vue) and Weather Flow with their Sky, Air and more recently Tempest (see the gallery below) units.

The Weather Flow unit is perhaps the most innovative in the consumer data space at the moment, with haptic sensors for measuring rain and sonic for wind it means there are no moving parts. Wind data is sampled and transmitted every 3 seconds with data including air pressure, humidity, ultraviolet, solar radiation and lightning detection transmitted every minute.

The nice part of weather data collection and visualisation is that it is adaptable to new methods and thoughts for communicating the feeds. We have linked all our systems up via a central MQTT distribution, currently running on a Rasberry Pi and from there we have built websites and devices to provide access to the data.

You don’t have to own your own weather station, however, there are a number of sites that allow access to weather station data, from the raw sensor data through to forecast and conditions data – seeĀ  Open Weather Map, Dark Sky to name but two.

The image gallery below provides a snapshot of some of our data devices – for our physical devices we have linked up the MQTT to Raspberry Pi’s and Neopixels to provide a modern take on both the themometer and wind speed displays with lights indicating rising or falling temperate and the current wind and temperature data. In addition we have used Servos and Stepper Motors to create wind and current conditions dials with displays designed in Fusion 360 and 3D printed, these have been powered by Node MCU’s.

There is something quite powerful about glancing at a physical device, displaying data collected on a second by second basis, that creates a more direct mode of data communication.

Traditional environmental measuring devices – such as Barometers and Barographs can also be converted to display digital data – we show examples in the gallery below and plan to post an update on converting no longer working analogue devices to digital in the coming weeks. You can read more thoughts on creating physical devices to display weather data via an interview with Professor Andrew Hudson-Smith in the Tempest Newsletter.

We are also pleased to announce the Open Gauges Project – A series of climate driven data guages to 3D print or Retrofit – see our Open Gauges site for full details.