The following article is a guest post by Jiaxu Wu, one of our 2018/19 Smart Cities and Urban Analytics students. The project focused on analysing data from an IoT project deployed at scale across the UCL Bloomsbury campus.
Sensors are increasingly being installed across campuses to help us understand how those environments are used. In 2017, UCL launched a “space availability project”, installing occupancy sensors in most of their libraries. The technology behind them is a Passive Infrared (PIR) sensor triggered by the presence of an object with a different temperature to the background. In collaboration with IDEA company and UCL, the research project used the sensor data collected from 2018-02-04 to 2019-05-31 in the Main Library to explore occupancy patterns.
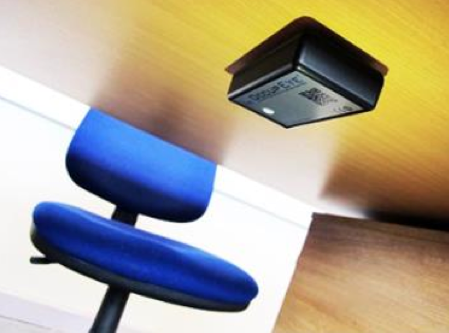
Occupeye sensor. Source: https://www.occupeye.com/
Below is the visualization of average spatial occupancy rate by day. It is showed that the occupancy rate of Main Library is highly dependent on the term dates. However, compared with the current electricity consumption plan, it is found that the energy consumption is steady for the whole year and is not in proportional to the actual occupancy, which can result in much energy and money wasting.
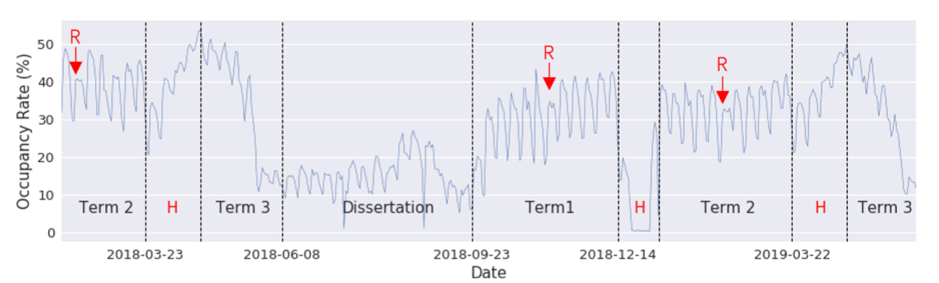
Average Spatial Occupancy Rate by Day (0:00 — 24:00) R: Reading Week; H: holiday.
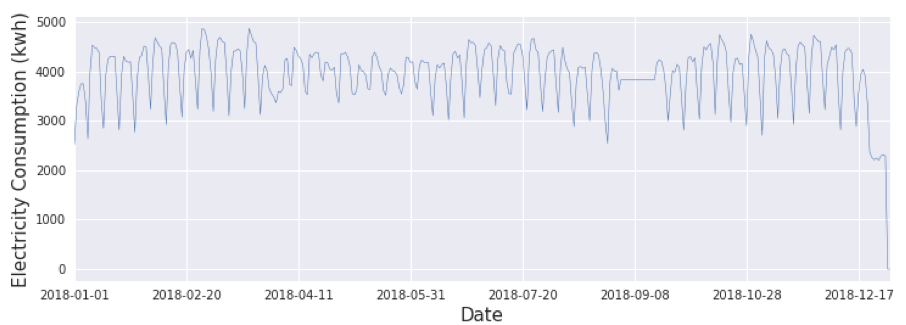
Daily Energy Consumption
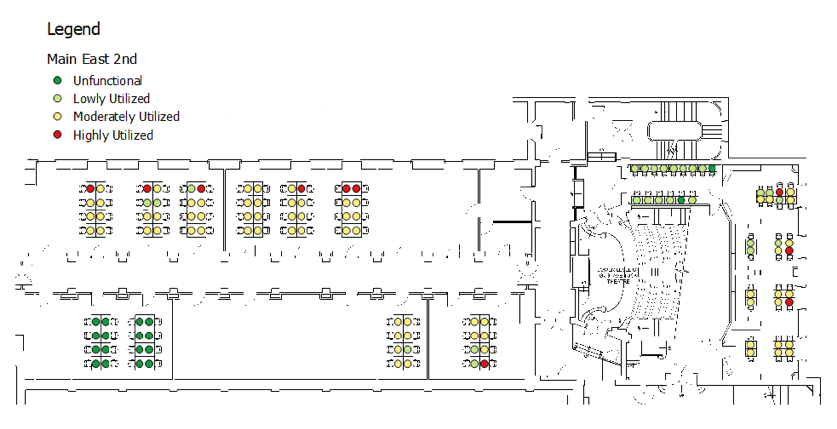
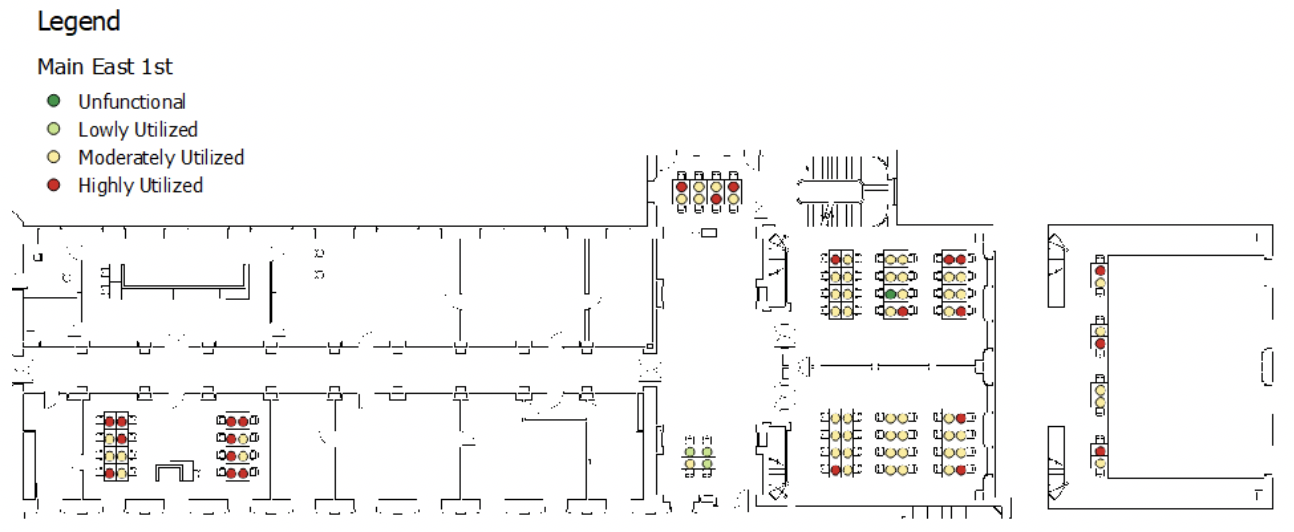
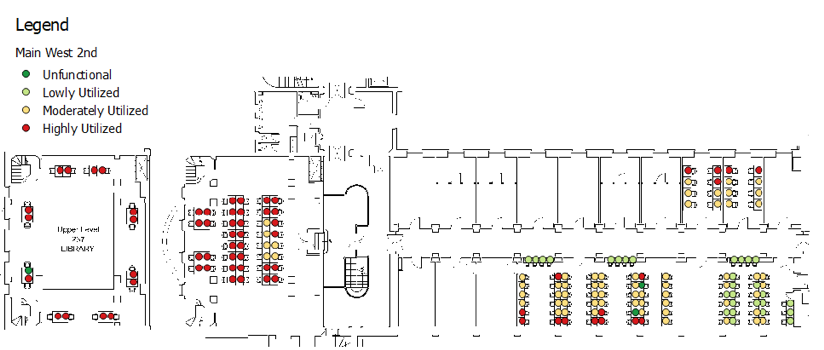
By applying partitioning clustering algorithms with Dynamic Time Warping (DTW) distance to time series data generated from 612 sensors, we group the desks in the library into “Lowly utilized”, “Moderately Utilized” and “Highly Utilized”. After visualization of our clustering result, we found that Law Room, Main West 1st floor and Main East 1st floor can be seen as well-utilized. However, the desk utilization in Main West 2nd floor is unevenly distributed, and the utilization of Main East 2nd floor is not so satisfactory.


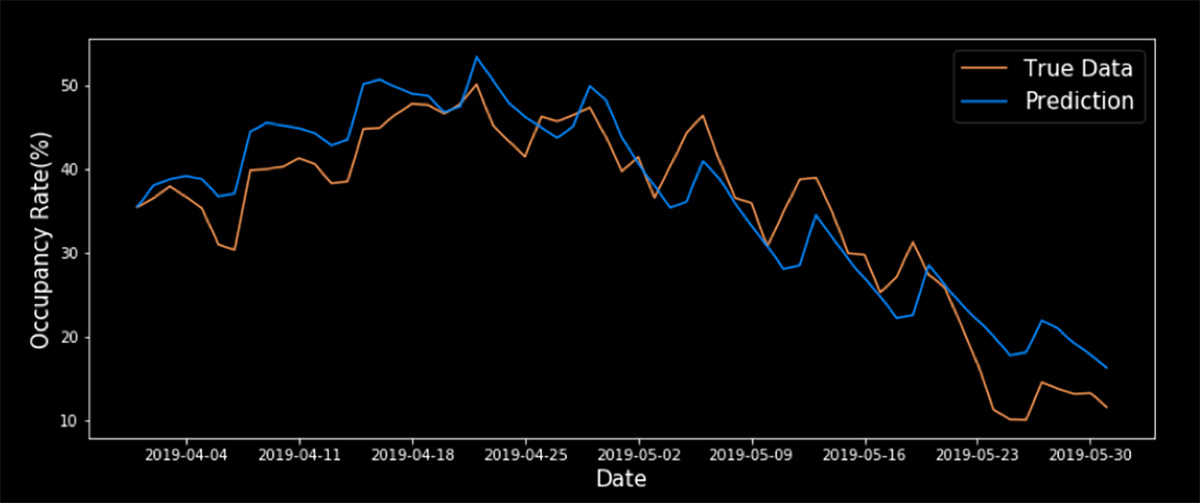
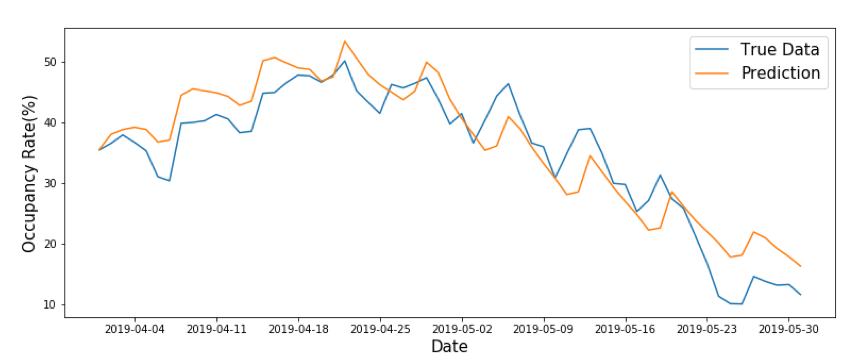
By applying ARIMA model and LSTM model to time series of daily occupancy rate, we provide two ways to predict the future occupancy. The RMSE of ARIMA model is 4.7 while LSTM is 5.4. It is proved that ARIMA, the traditional linear model, has more steady result and is more suitable for this case of study.
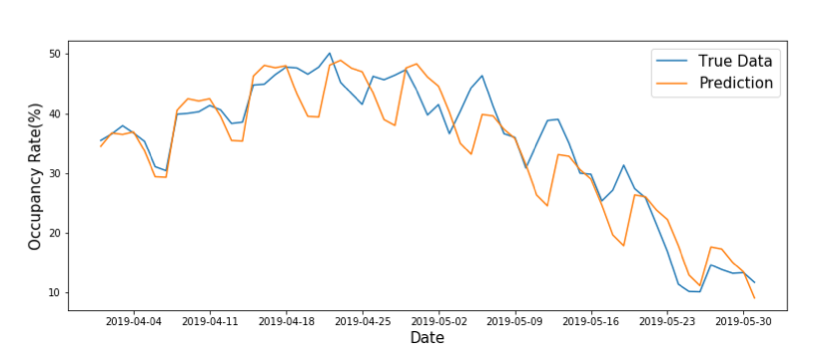
Prediction Result of ARIMA Model
Prediction Result of LSTM Model
In the future, the occupancy sensor data can provide more applications in smart campus. For example, university can build an APP or provide interactive screens in libraries to give real time spatial distribution of available desks. The APP can also suggest students which library has more available desks based on their locations. Those approaches can largely save students’ time during highly utilized period. The prediction of occupancy rate can also be used as reference for students to decide when to go to the library and how to avoid over-crowding in advance. By clustering sensors into different groups with different levels of utilization, managers can make decisions about if some places need to be closed during lowly utilized period, or think about reasons behind lowly-utilized desks and improve their user friendliness. Overall, the potential of occupancy sensors in the future is worth expected.
Author: Jiaxu Wu, MSc Smart Cities and Urban Analytics 2018-2019, UCL