
Open Weather Map Barometer
The Open Gauges project aims to allow open-source data gauges to be built, modified, and viewed as both physical (3d printed) and digital gauges. Depending on the user’s preference the models can be made to run from any online data source with a data feed – from Weather Data with Air Pressure, Temperature, Wind Speed etc though to Air Quality Gauges, Noise Meters, Energy etc.
Part of the initial release, from the Connected Environments Team at The Bartlett Centre for Advanced Spatial Analysis, University College London, and alongside the more traditional ‘dial style’ gauges, is our new Neopixel Barometer, updated for Open Weather Map. Back in October we published the Weather Flow version, this new, open source version is specifically designed to use the free Open Weather Map API, making it easier to use.
Designed to be as simple as possible it is powered by a Raspberry Pi and uses the data feed from the Open Weather Map Single Call API, making it open to anyone with data available world world, according to your choice of location. So you could chose to display local Barometric Pressure or have a series of them on display showing locations around the world. Each gauges updates every 5 minutes with a Green Pixel to note successful data collection and Red for unsuccessful
Full code and files can be found in the Open Gauges Github Repository.
Data Source
The barometer uses the One Call API from Open Weather Map, provided as JSON.
Data displayed
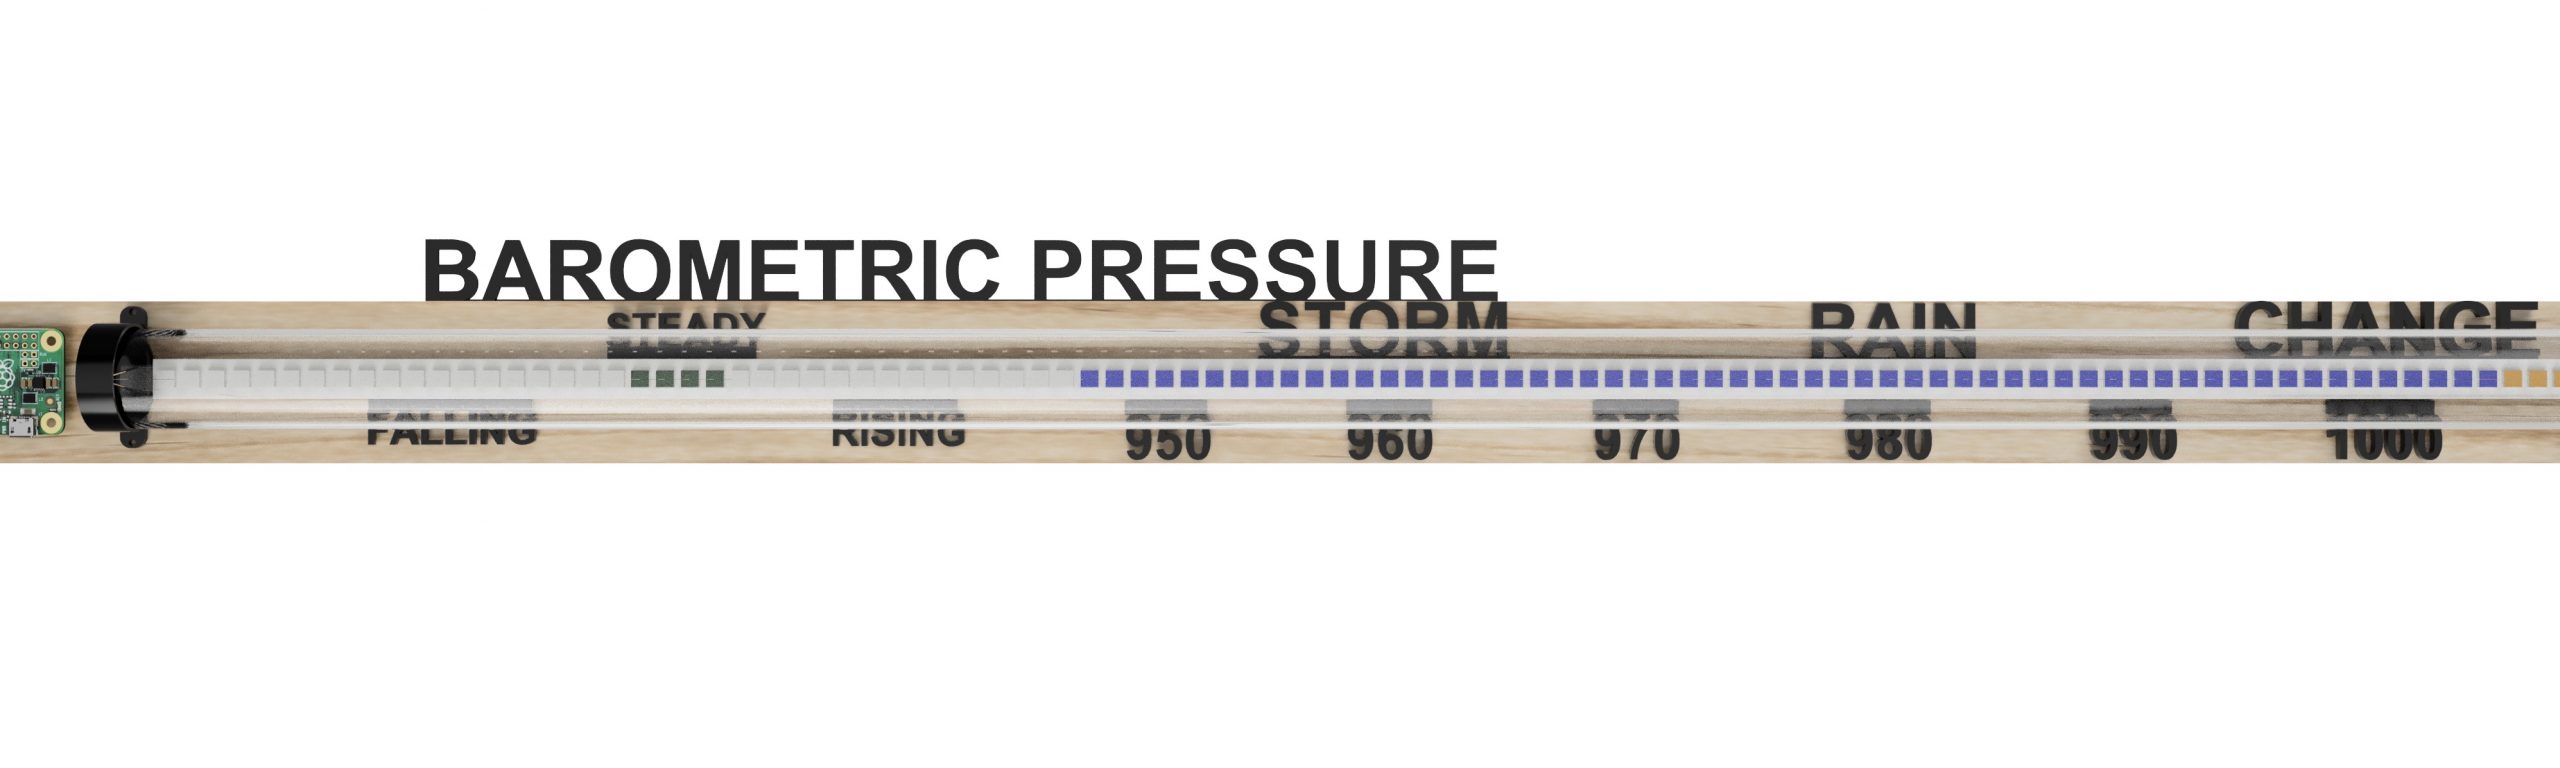
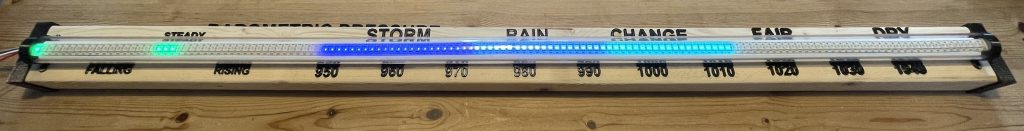
The Neopixel Barometer displays current sea level air pressure (Mb) and the current pressure trend – Rising, Steady, Falling.
The data updates every five minutes with a sweep of blue/yellow neopixels on power up. The pressure trend is calculated in the Python script, as its not part of the API. As such it takes 3 hours to calibrate – with ‘Rising’ shown initially and then changing to the current trend after 3 hours of data has been downloaded.
3D printed model
The main barometer markers – ie STORM, FAIR, CHANGE, as well as the numbers – 950, 960 etc are provided as separate .stl files to 3D print. This is to allow easy alignment with the Neopixel strip with the correct pixel.
The conditions come in a single section, again to be aligned once the Neopixel strip is mounted, the Trend titles are also provided. We also provide the end caps for the Acrylic Tube (optional, see below).
Wood
The Neopixel strip is can be mounted either onto a thin strip of wood approx 125 centimetres long by 4.5 cm wide using the fixings that come with the Neopixel Strip, or with a wider block. The Text/Numbers are 3D printed (as above) and glued on the wood. It is a standard wood strip that most DIY/Hardware stores stock. The use of wood/mounting is to allow flexibility – ie mount it however you like.
Acrylic Tube
For this updated version we adapted the model to allow the additional use of an 1m x 28mm Acrylic Tube, widely available it allows the LED strip to be mounted into the tube (we used a piece of conduit to straighten the led strip). This give the barometer a more ‘finished look’ and provides more of a nod towards the mercury barometers of old.
Hardware
The hardware has been selected to be as low cost as possible –
- A Raspberry Pi – We used the Raspberry Pi Zero W
- 1 Meter 144 Addressable Neopixel Strip (NeoPixel/WS2812/SK6812 compatible) – Example here from The PiHut
It is made to be mounted either vertically or horizontally.
Open Weather Map Barometer – Wood/NeoPixels
Code and library
The full code/3d printing files etc are provided on the Github page, which also includes the other Open Gauges to 3D print and make.
Libraries used
- requests
- json
- time
- neopixel
- board
Digital model
The model is also provided in Fusion 360 for any edits to wording, sizing etc (note the Pi is not included due to separate licensing).