Imagine wielding the power of the Force, not to fight Sith Lords, but to display real-time data – in our case, wind speed, but the code/build can be adapted to any data feed. Using a NeoPixel strip inside a lightsaber tube, we can create a stunning visual representation of wind speeds. In this post, we’ll look at the build and dive into the code and the concept, helping you turn a lightsaber blade into a unique data meter. The build is part of the ongoing Open Gauges Project, which provides code and 3D print files to build several open-source data gauges.
Why a Lightsaber?
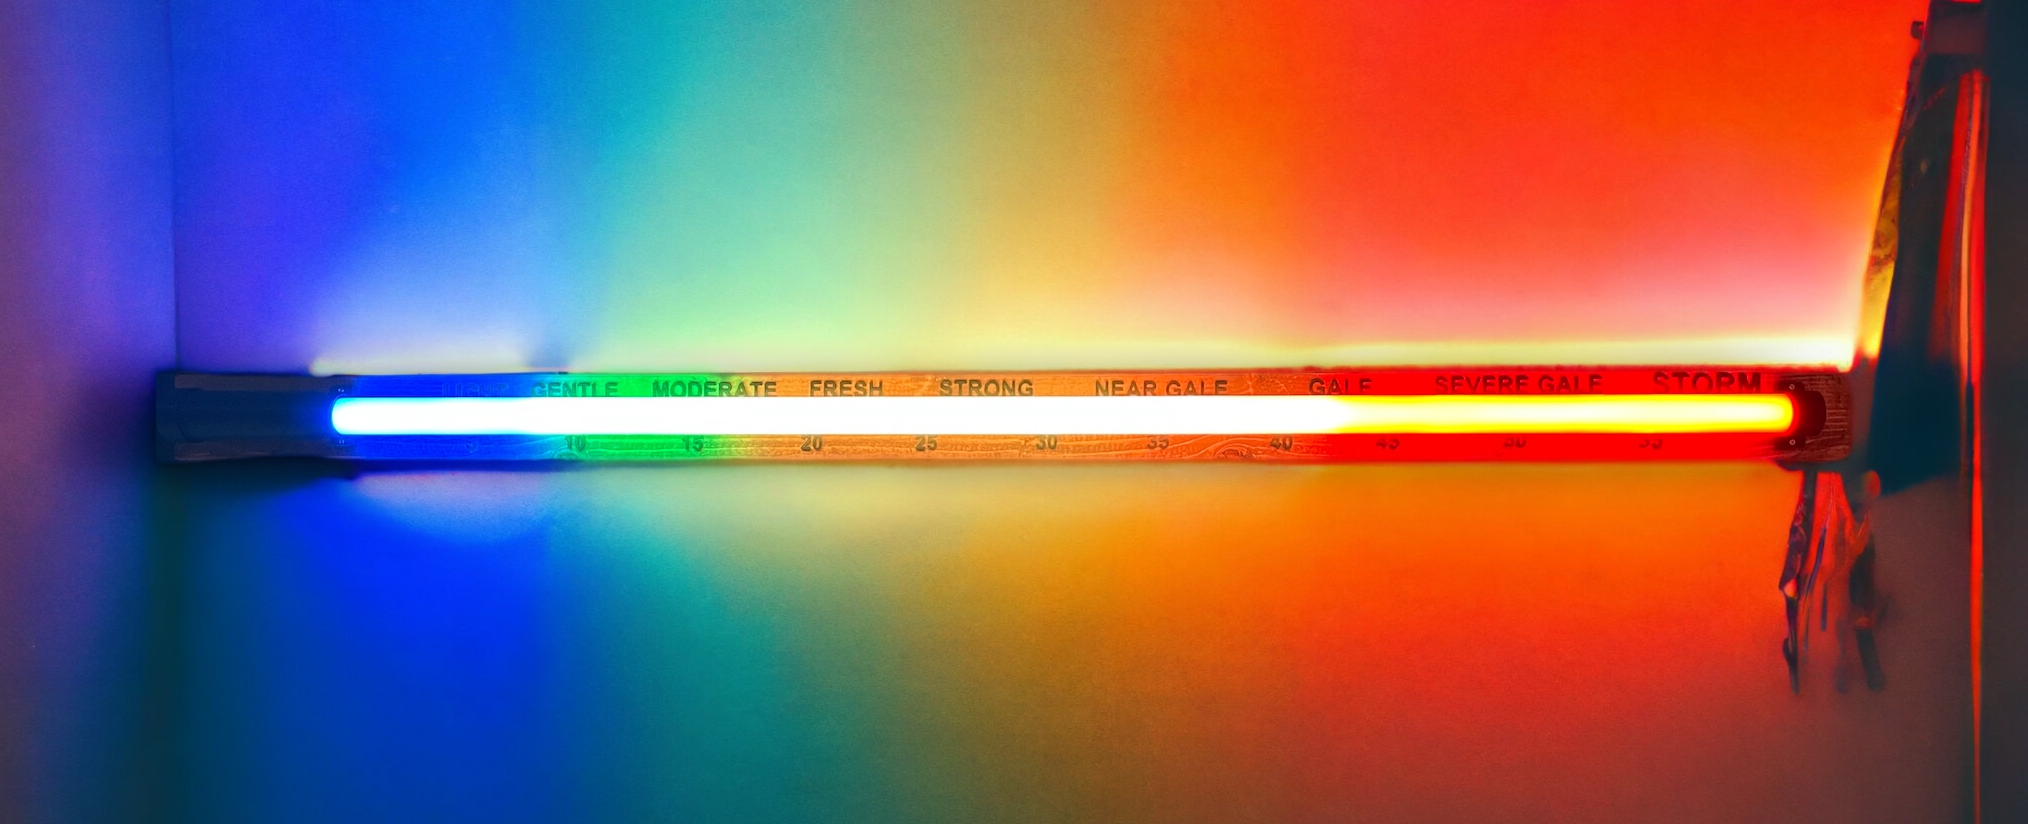
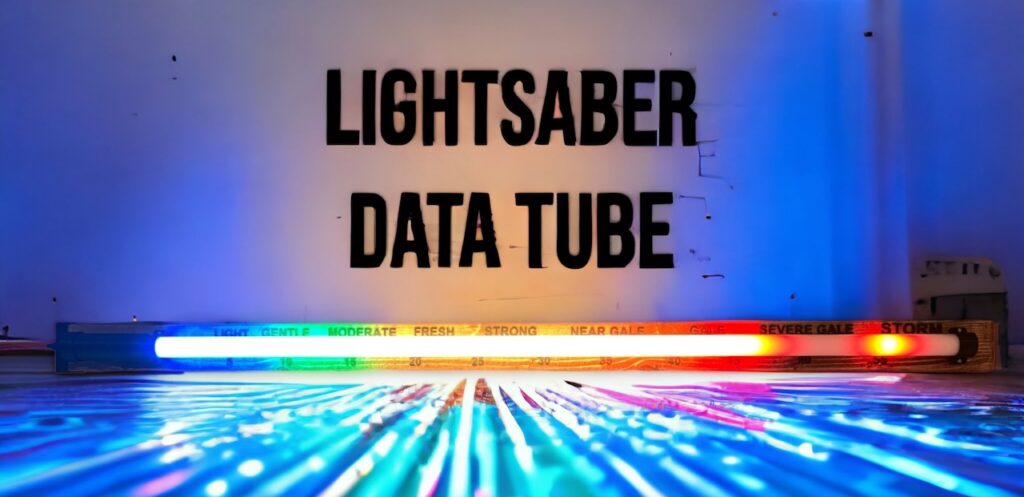
LightSaber Data Tube
Aside from it being just plain cool, the lightsaber’s blade offers a perfect medium for light diffusion. This means that each individual LED’s light on the NeoPixel strip spreads out, blending smoothly with its neighbours, ensuring that the entire saber glows uniformly. This makes it easier to visualise and read the data as the light is distributed evenly across the length of the lightsaber.
Whether you’re a Star Wars fan, a weather enthusiast, or just someone looking for a cool project, this NeoPixel Lightsaber wind meter offers a fun and educational experience. May the winds be with you!
The Hardware
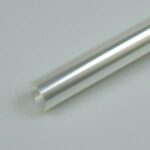
The main tube comprises a 1″ OD Thin Walled Trans White Polycarbonate Blade Tube with a one-metre-long Foam Diffuser Tube to add to the diffusion level. The diffuser tube is also wrapped in a length of Blade Diffusion Film. All of these are sourced from the excellent https://thesaberarmory.com/ in the UK.
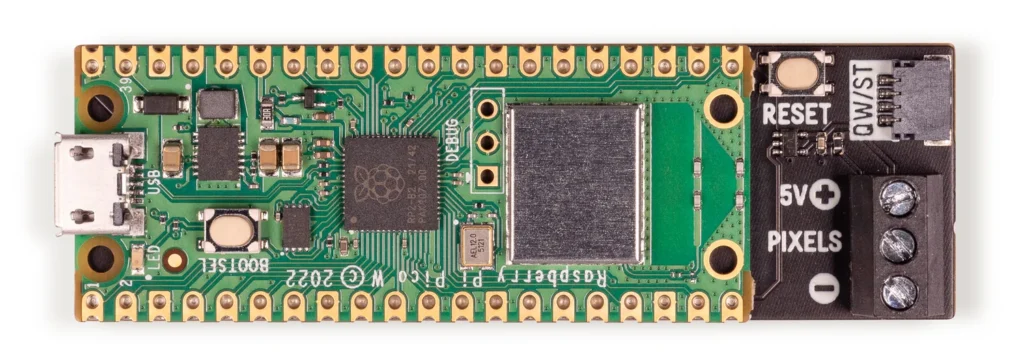
Plasma Stick 2040W
We put a standard 144 WS2812b Neopixels inside the foam tube in a one-metre strip. This is subsequently wrapped in the Blade Diffusion Film, which fits inside the Polycarbonate Tube. This is how most lightsabers are made; a strip of Neopixels inside a diffuser to make for smooth fluorescent-like lighting inside the tube. To power it, we use a Pi PicoW. Any Pi Pico will do, but Pimoroni makes one precisely for Neopixels, the Plasma Stick 2040W PicoW Aboard.
-

- Diffused Thin-Walled Tube
-
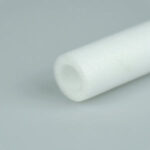
- Diffuser Foam
-
- Blade Foil
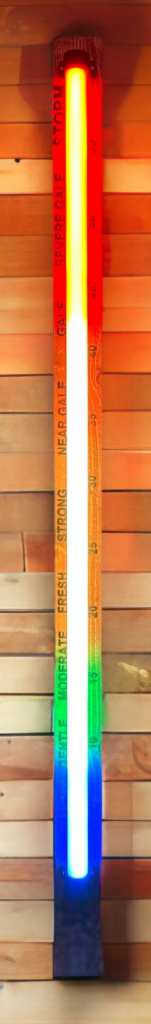
The lightsaber tube is mounted onto a 1.25-metre length of timber using a top and bottom end mount, which are 3D printed; all the 3D printed files are available in the GitHub Repository. The bottom part is a holder for both the Light Saber tube and the PicoW, with a screw on the bottom lid allowing easy access to the wiring.
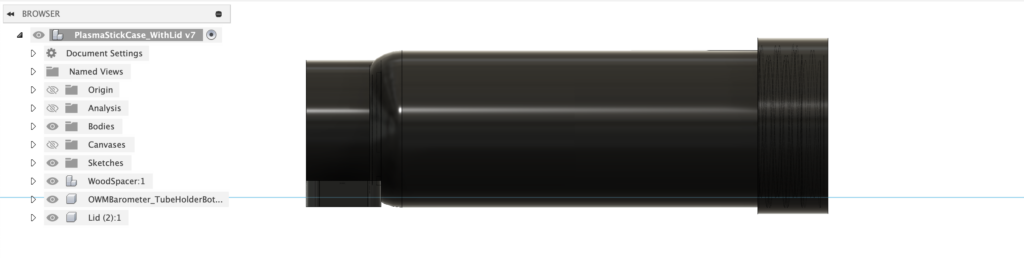
Lightsaber Data Tube Holder – Fusion 360
The following YouTube clip from the Saber Armory provides an excellent guide to assembling the sabre. We use a flexible neopixel strip and, of course, different mounts, but the build is similar:
The NeoPixels
NeoPixels are individually addressable RGB LEDs. These are LEDs where you can control the colour and brightness of each individual light diode on the strip. With a long strip of these LEDs inside a lightsaber tube, we can represent wind speeds by lighting up different portions of the strip in varying colours.
How Do We Represent Wind Speed?
We divide the range of possible wind speeds into sections. In our code example, these sections are represented by colors:
- 0 to 10: BLUE (Low winds)
- 10 to 20: GREEN (Fresh winds)
- 20 to 30: YELLOW (Moderate winds)
- 30 to 40: ORANGE (Strong winds)
- Above 40: RED (Above Gale Force)
As the wind speed increases, more of the strip lights up, moving through the colors as it progresses. Additionally, the highest wind speed measured is indicated with a RED pixel, serving as a max wind marker. This resets at midnight and provides an at-a-glance view of the maximum wind gust for the day.
Let’s Dive into the Code
All the files required are available in the GitHub Repository. We have aimed to make it as simple as possible to understand and edit. As such, we break down the code below. If you want to, you can simply copy across all the files from our GitHub to your PiPicoW, edit the config file for your wifi and our example should happily work. However, if you want to know more about the workings –
The heart of our project is the NeoPixel library and the MQTT protocol to receive wind speed data (we explore this in more depth below). We use MQTT as it allows real-time data to be effectively streamed to the Lightsaber blade. It also means the data can be swapped for other feeds as needs be, such as Air Pressure, Air Quality, Temperature etc – indeed any numerical data stream you can find. Our MQTT stream is provided by a Davis Vantage Pro 2 via Weewx on a Raspberry Pi which outputs the MQTT stream.
First, we set up the NeoPixel strip:
from neopixel import Neopixel

# Set up NeoPixels numpix = 144 pixels = Neopixel(numpix, 0, 15, "GRB") pixels.brightness(255)
Next, we define our wind speed ranges and corresponding colors – this can be edited according to the wind speed range you want to use.
colors = {
    'BLUE': (0, 0, 255),
    'GREEN': (0, 255, 0),
    ...
}

WIND_SPEED_RANGE = [0, 60]
multiplier = numpix / (WIND_SPEED_RANGE[1] - WIND_SPEED_RANGE[0])
- A gentle breeze is shown in blue, indicative of calm weather.
- As the wind picks up, the colors transition to green, a universal symbol of ‘go’ or safety.
- When winds grow stronger, the color shifts to yellow, suggesting caution.
- Higher wind speeds are shown in orange, and finally,
- Potentially dangerous wind speeds are indicated with red, universally associated with warnings and danger.
This gradual change of colors not only represents the data but also provides an intuitive sense of the wind’s intensity.
Dynamic Updates
The script dynamically updates the NeoPixel colors as the wind speed changes. By using a threshold, minor fluctuations are filtered out preventing the display from changing too frequently and thus improving the readability of the data. Only significant changes in wind speed result in a color change, ensuring a clear and comprehensible visual output.
Tracking the Peak Wind Speed
The script utilizes global variables to keep track of the current maximum wind speed (max_wind) and the previous maximum (prev_max_wind). The function sub_cb updates these values as new wind speed messages are received via MQTT (we explore MQTT more in the next step):
if wind > max_wind:
    max_wind = int(wind)
This simple logic ensures that only the highest wind speed is showcased as the maximum.
Visualizing the Maximum Wind Speed
The maximum wind speed is visualized distinctly by coloring a specific NeoPixel in red. This is handled in the set_pixel_colour function:
pixels[max_wind] = colors['RED'] # Update max_wind pixel
This code assigns the ‘RED’ color from the colors dictionary to the pixel at the index corresponding to the maximum wind speed. This red marker provides an immediate visual indicator of the peak intensity of the wind speed for the current observation period.
Dynamic Updates and Resets
As the wind speed changes, the script continuously updates the display. If a new maximum is detected, it changes the appropriate pixel to red, and the previous maximum pixel reverts to its color that corresponds to its wind speed range. This dynamic updating gives real-time feedback about the wind’s behavior.
Furthermore, the script includes a scheduled reset at midnight:
if current_time[3] == 0 and current_time[4] == 0:  # Check if hour and minute are both 0
    machine.reset()
Understanding MQTT in Our NeoPixel Lightsaber
MQTT, which stands for Message Queuing Telemetry Transport, is a lightweight messaging protocol designed for low-bandwidth, high-latency, or unreliable networks. It’s become the de facto standard for IoT devices due to its simplicity and effectiveness. In our project, we use MQTT to receive wind speed data which then drives the NeoPixel display.
How MQTT Works
At a high level, MQTT operates over a publish/subscribe model:
- Broker: A central server that receives messages from publishers (devices or applications that produce data) and routes them to subscribers (devices or applications that consume data). The broker manages active clients and topics.
- Topic: Think of it as a “channel” where data is published. Clients can subscribe to topics or publish data to them.
- Message: The data or information sent from the publisher to the subscriber.
Implementing MQTT in our Lightsaber
In our code, the MQTT protocol is implemented using the excellent mqtt_as library.
Setting up our MQTT client:
from mqtt_as import MQTTClient, config

# Define configuration
config['subs_cb'] = sub_cb
config['wifi_coro'] = wifi_han
config['connect_coro'] = conn_han
config['clean'] = True

# Set up client
MQTTClient.DEBUG = True
client = MQTTClient(config)
Subscribing to a topic – our topic provides wind speed data every 3 seconds. You can leave this topic in to test your system works, and then replace it with your own data, or any other data source.
async def conn_han(client):
    await client.subscribe('personal/ucfnaps/downhamweather/windSpeed_mph', 1)
When a message is published to this topic, our sub_cb function is triggered.
Processing Received Data
def sub_cb(topic, msg, retained):
    ...
    wind_speed = float(msg)
    ...
We convert the received message into a number, which represents our wind speed. Depending on the wind speed value, the corresponding section of the NeoPixel strip is illuminated.
The main logic for setting the color of the pixels based on the wind speed is in the set_pixel_color function. This function checks if the wind speed has increased or decreased since the last measurement and updates the lightsaber’s glow accordingly.
The full code is below:
from neopixel import Neopixel
from mqtt_as import MQTTClient, config
from config import wifi_led, blue_led
import uasyncio as asyncio
import machine
import ntptime
import time

# Set up NeoPixels
numpix = 144
pixels = Neopixel(numpix, 0, 15, "GRB")

colors = {
    'BLUE': (0, 0, 255),
    'GREEN': (0, 255, 0),
    'YELLOW': (255, 100, 0),
    'ORANGE': (255, 50, 0),
    'RED': (255, 0, 0),
    'OFF': (0, 0, 0)
}

pixels.brightness(255)
prev_wind = 0
prev_max_wind = 0
max_wind = 0  # Initialize max_wind

WIND_SPEED_RANGE = [0, 60] #actual is half this amount to allow the max wind marker virtually
multiplier = numpix / (WIND_SPEED_RANGE[1] - WIND_SPEED_RANGE[0])

UPDATE_THRESHOLD = 2  # Only update if wind speed changes by 2 or more

def set_pixel_color(wind, max_wind):
    global prev_wind

    if abs(wind - prev_wind) < UPDATE_THRESHOLD:
        return

    while prev_wind < wind:
        update_pixels(prev_wind)
        time.sleep(0.05)
        prev_wind += 1

    while prev_wind > wind:
        update_pixels(prev_wind)
        time.sleep(0.05)
        prev_wind -= 1

    pixels[max_wind] = colors['RED']  # Update max_wind pixel

    pixels.show()


def update_pixels(wind_value):
    for i in range(1, numpix):
        if i <= wind_value < numpix:
            if i <= 20:
                color = colors['BLUE']
            elif i <= 40:
                color = colors['GREEN']
            elif i <= 80:
                color = colors['YELLOW']
            elif i <= 100:
                color = colors['ORANGE']
            else:
                color = colors['RED']
            pixels[i] = color
        elif i == max_wind:  # Use max_wind directly
            pixels[i] = colors['RED']
        else:
            pixels[i] = colors['OFF']
    pixels.show()

def sub_cb(topic, msg, retained):
    global max_wind, prev_max_wind

    print(f'Topic: "{topic.decode()}" Message: "{msg.decode()}" Retained: {retained}')
    wind_speed = int(msg)

    if WIND_SPEED_RANGE[0] <= wind_speed <= WIND_SPEED_RANGE[1]:
        wind = (wind_speed - WIND_SPEED_RANGE[0]) * multiplier

        if wind > max_wind:
            max_wind = int(wind)

        if max_wind != prev_max_wind:  # Check if max_wind has changed
            print("Max Wind", max_wind)
            prev_max_wind = max_wind

        set_pixel_color(wind, max_wind)
    else:
        for i in range(numpix):
            pixels[i] = colors['OFF']
        pixels.show()


async def get_current_minute():
    try:
        ntptime.settime()
        current_time = time.localtime()
        return current_time[4]
    except:
        print("Could not get the time from the internet")
        return None

#Reset Wind Max and System at Midnight
async def reset_on_hour():
    while True:
        try:
            ntptime.settime()  # Get the current time from the internet
            current_time = time.localtime()
            if current_time[3] == 0 and current_time[4] == 0:  # Check if hour and minute are both 0
                machine.reset()
            else:
                await asyncio.sleep(60 - current_time[5])
        except:
            print("Could not get the time from the internet")
            await asyncio.sleep(60)  # Retry after 1 minute if time sync fails


async def heartbeat():
    s = True
    while True:
        await asyncio.sleep_ms(500)
        blue_led(s)
        s = not s

async def wifi_han(state):
    wifi_led(not state)
    print('Wifi is ', 'up' if state else 'down')
    await asyncio.sleep(1)
    if state:
        asyncio.create_task(reset_on_hour())  # Start reset_on_hour task after WiFi is connected

async def conn_han(client):
     # await client.subscribe('personal/ucfnaps/saber/config/', 1)
       await client.subscribe('personal/ucfnaps/downhamweather/windSpeed_mph', 1)

async def main(client):
    try:
        await client.connect()  # Ensure WiFi and MQTT connection before starting other tasks
    except OSError:
        print('Connection failed.')
        return

    n = 0
    while True:
        await asyncio.sleep(5)
        n += 1

# Define configuration
config['subs_cb'] = sub_cb
config['wifi_coro'] = wifi_han
config['connect_coro'] = conn_han
config['clean'] = True

# Set up client
MQTTClient.DEBUG = True
client = MQTTClient(config)

asyncio.create_task(heartbeat())

try:
    asyncio.run(main(client))
finally:
    client.close()
    asyncio.new_event_loop()
Bringing it All Together
We also provide two wall mounts which screw onto the back of the backing wood. This provides spacing so the Lightsaber Wind Gauge has a space off the wall as well as a hook for a standard nail or screw. The wood was dyed with Dark Oak wood stain and the wind speed indicators (text and numbers) were glued at the corresponding lengths along the lightsaber blade.
LightSaber Data Tube – Fusion360
To effectively space the numbers/text we changed the MQTT feed away from the realtime feed to a feed we can send data to (/saber/config). This allowed us to send the value from 5 to 60 and light up the tube, allowing us to visually see where the text/numbers are glued.
That completes the build, with the combination of the NeoPixel strip, MQTT for data transmission, and the aesthetic appeal of a lightsaber. We hope you agree that it makes for a unique and visually pleasing method to measure and display wind speed.