Studying health clinic operations is important to ensure efficiency and comfort for both staff and patients. Currently, the NHS faces a significant challenge with patient backlogs, particularly in eye clinics.
The Hercules project aims to address this issue by utilising a multidisciplinary approach to improve patient flow and the experiences of both staff and patients. This blog post explores the second phase of this project, namely The Connected Occupancy and Clinic Health (COACH unit) during the journey of its development and deployment, focusing on the various stages, from initial prototypes to deploying 20 COACH units in a Moorfields Eye clinic in London, the challenges encountered, and the innovative solutions implemented.
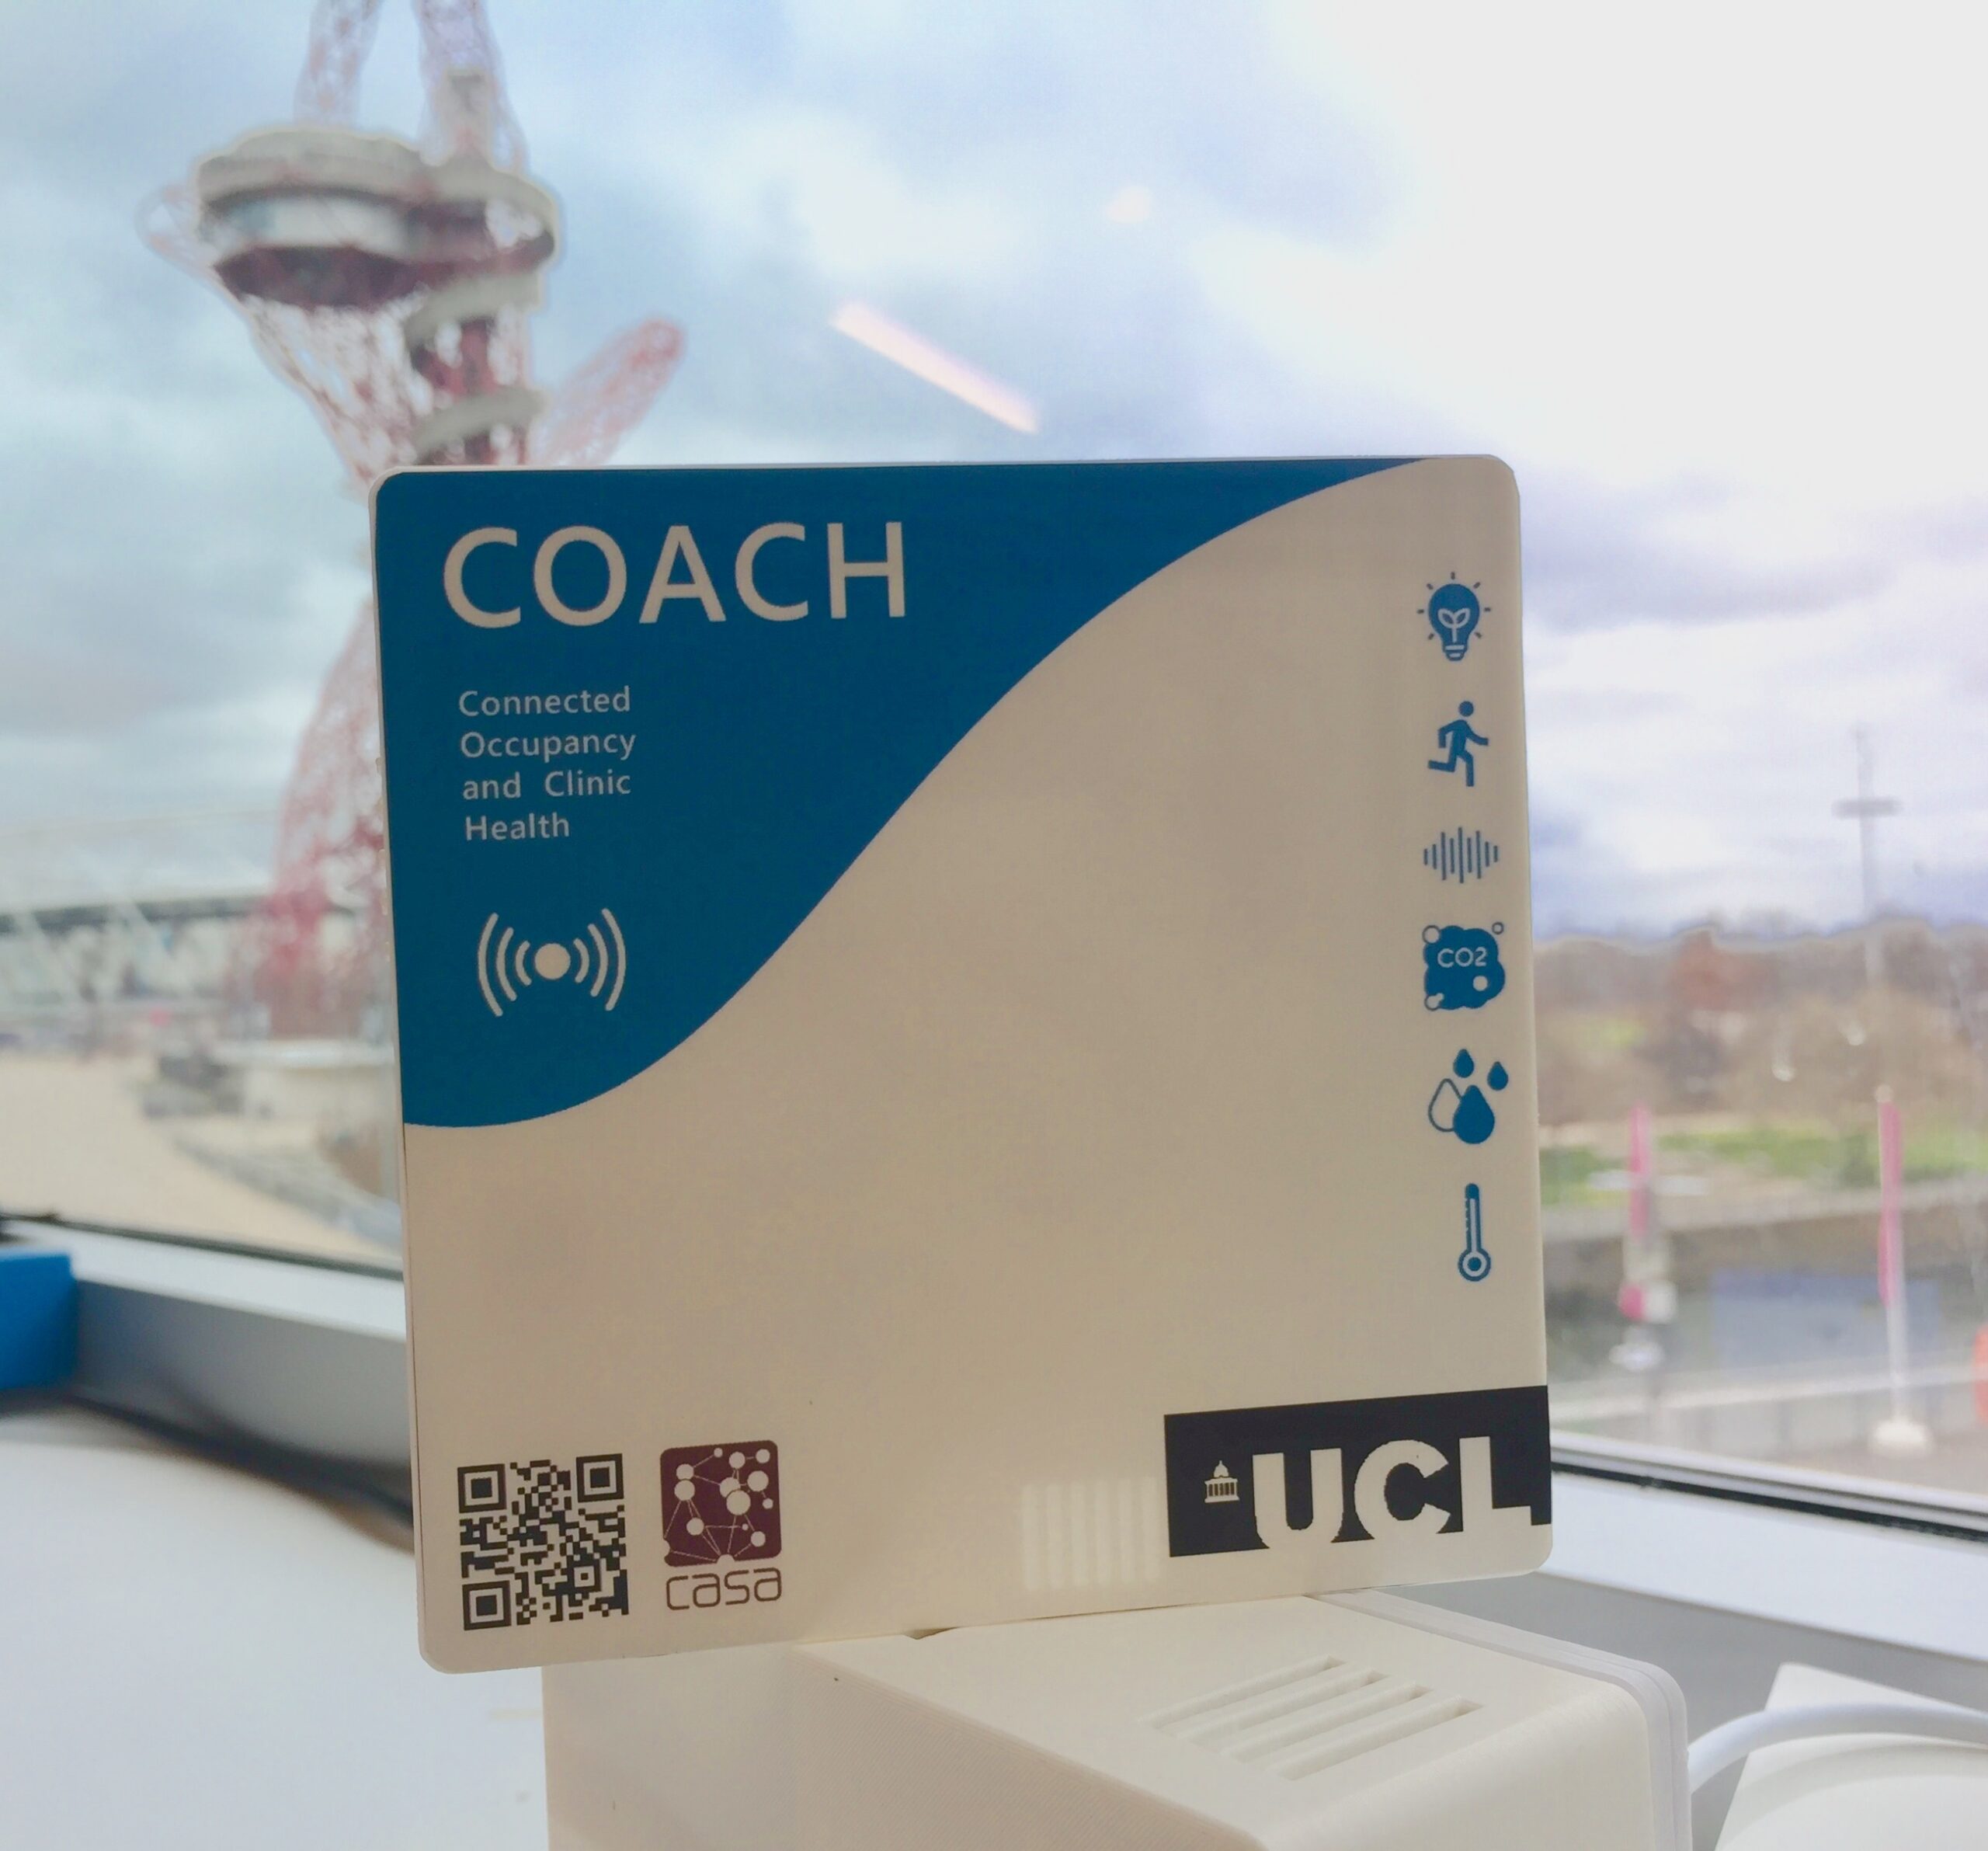
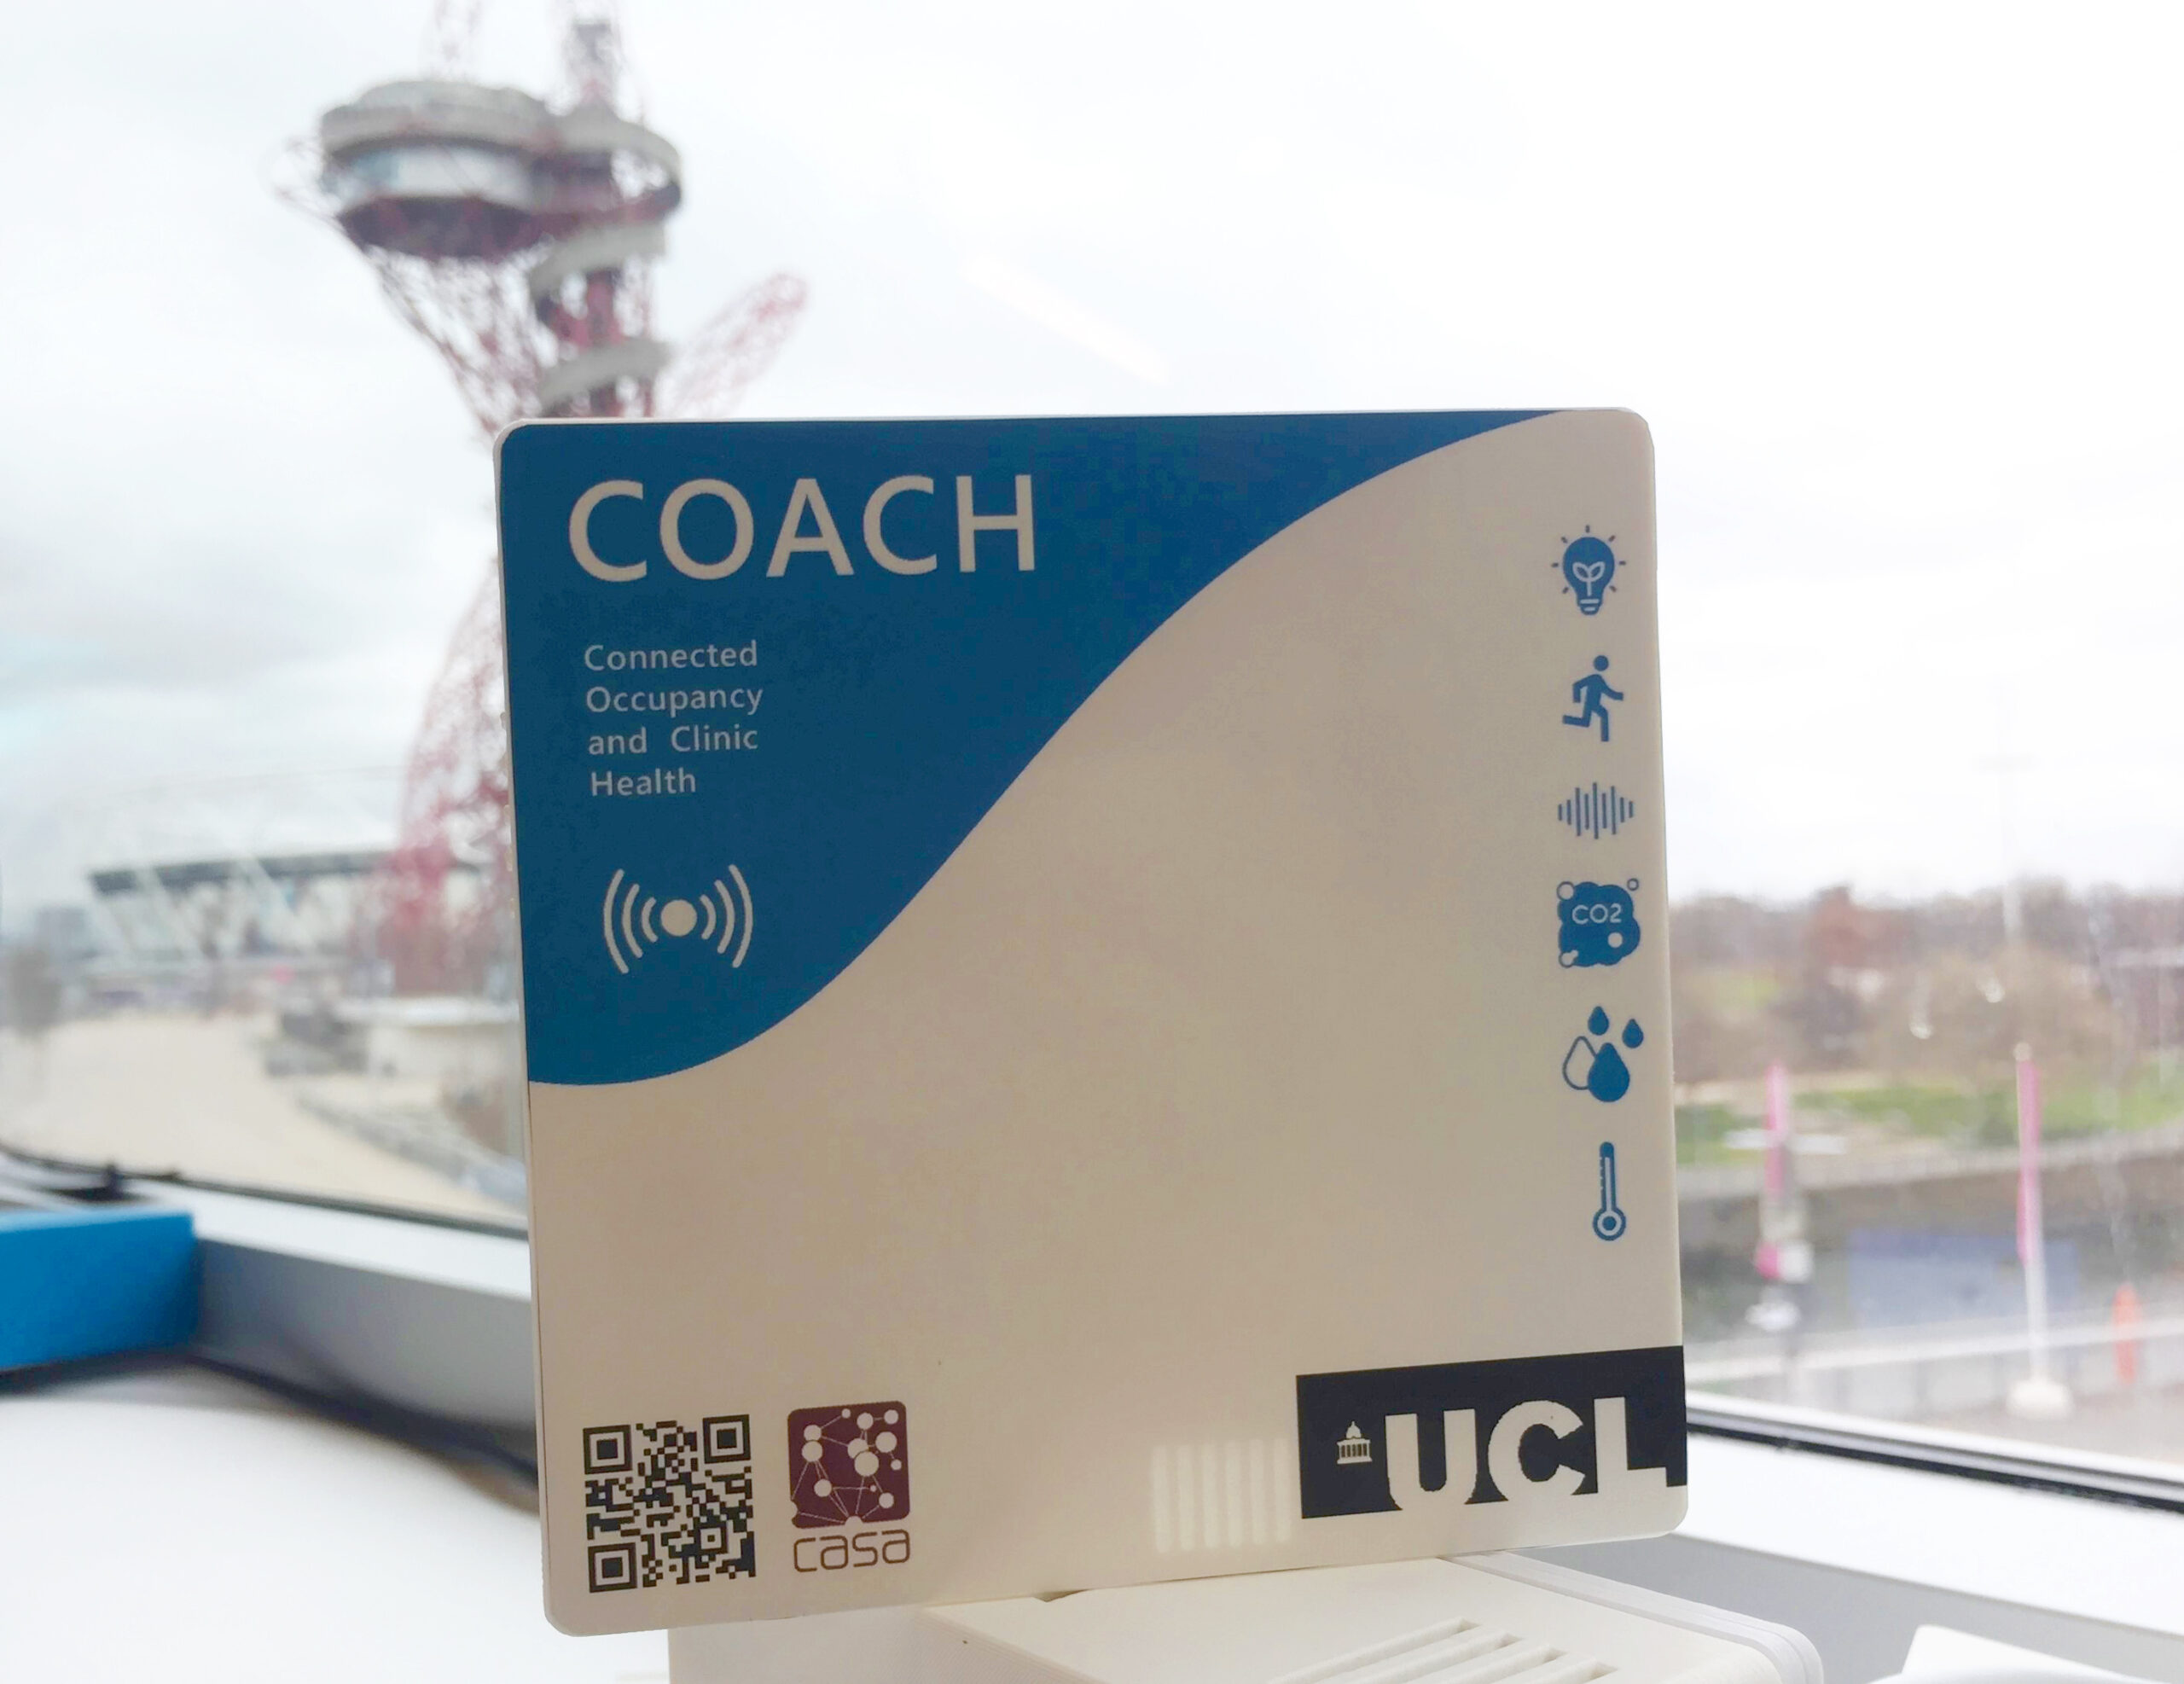
The Connected Occupancy and Clinic Health (COACH unit)
Context
The first phase of the Hercules research project began with tracking patient movements using Ubisense trackers. These trackers were provided to patients to monitor their journey throughout the clinic, aiming to understand patient flow.
However, this approach is patient-centric and only tells a certain aspect of the picture with more to be discovered. Only half of the patients agreed to carry a tracking tag, so the research team was keen to try other approaches. This led to the current phase, where the focus has been directed towards understanding the environment and occupancy within the clinic rather than individual patient tracking.
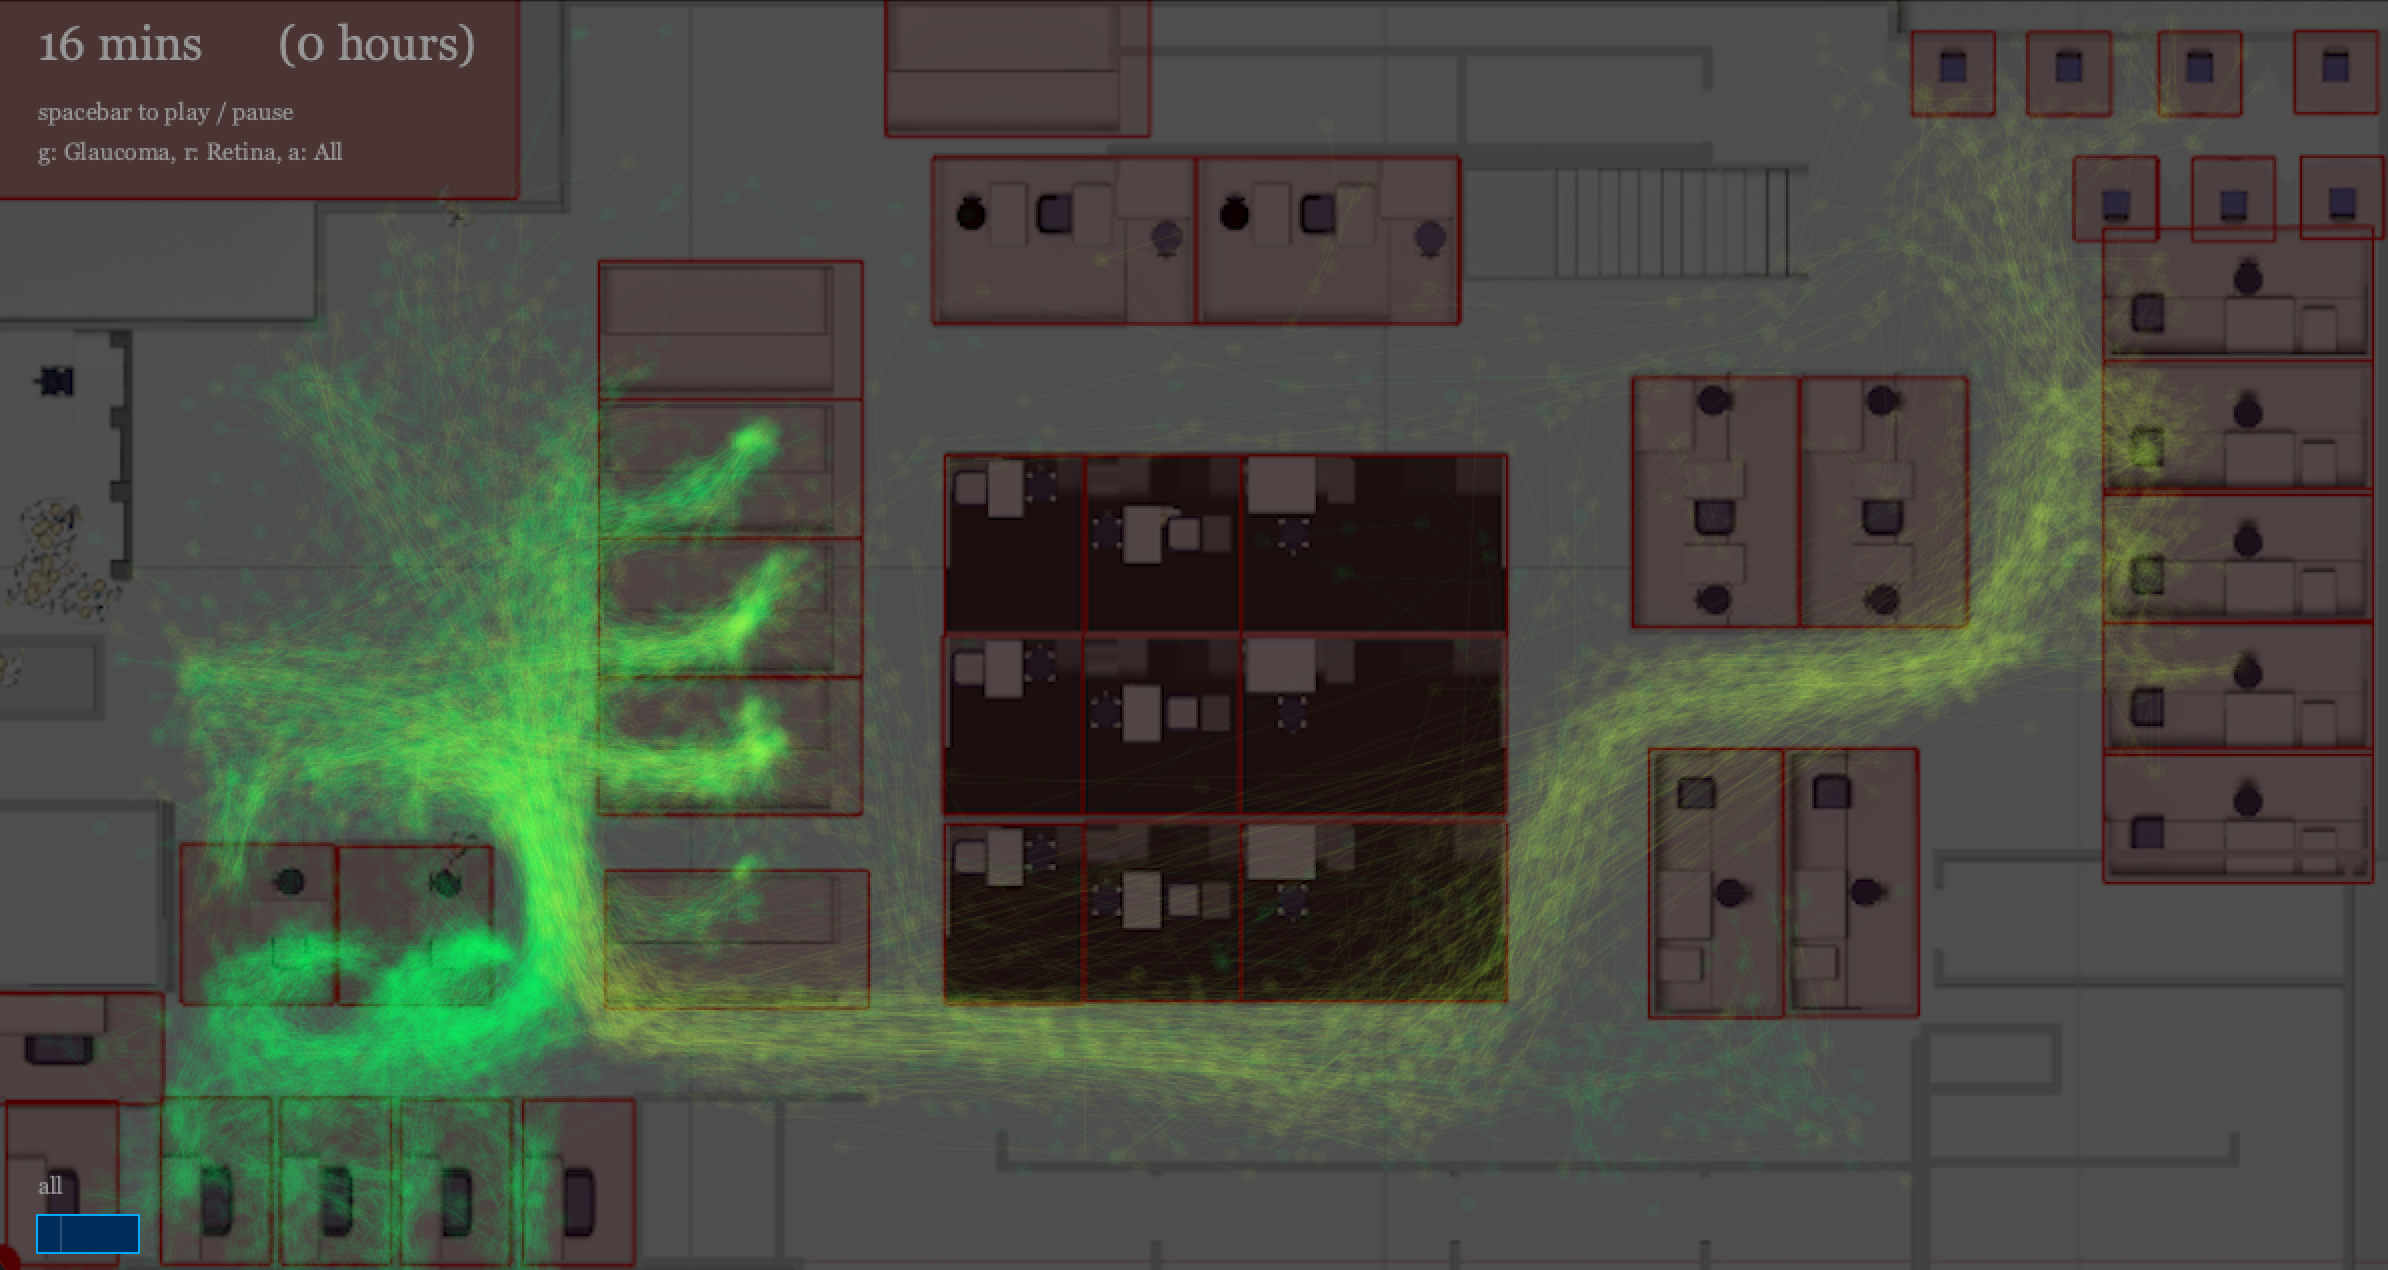
Patient flow from ultra-wideband (UWB) trackers visualised on the floorplan in phase 1 of the Hercules project
Acknowledgements
This project is funded by the NIHR Biomedical Research Centre at Moorfields Eye Hospital and on behalf of the Hercules Consortium. Team members from the Connected Environments lab are; Duncan Wilson, the project lead, Steven Gray, and Yaman Kalaji.
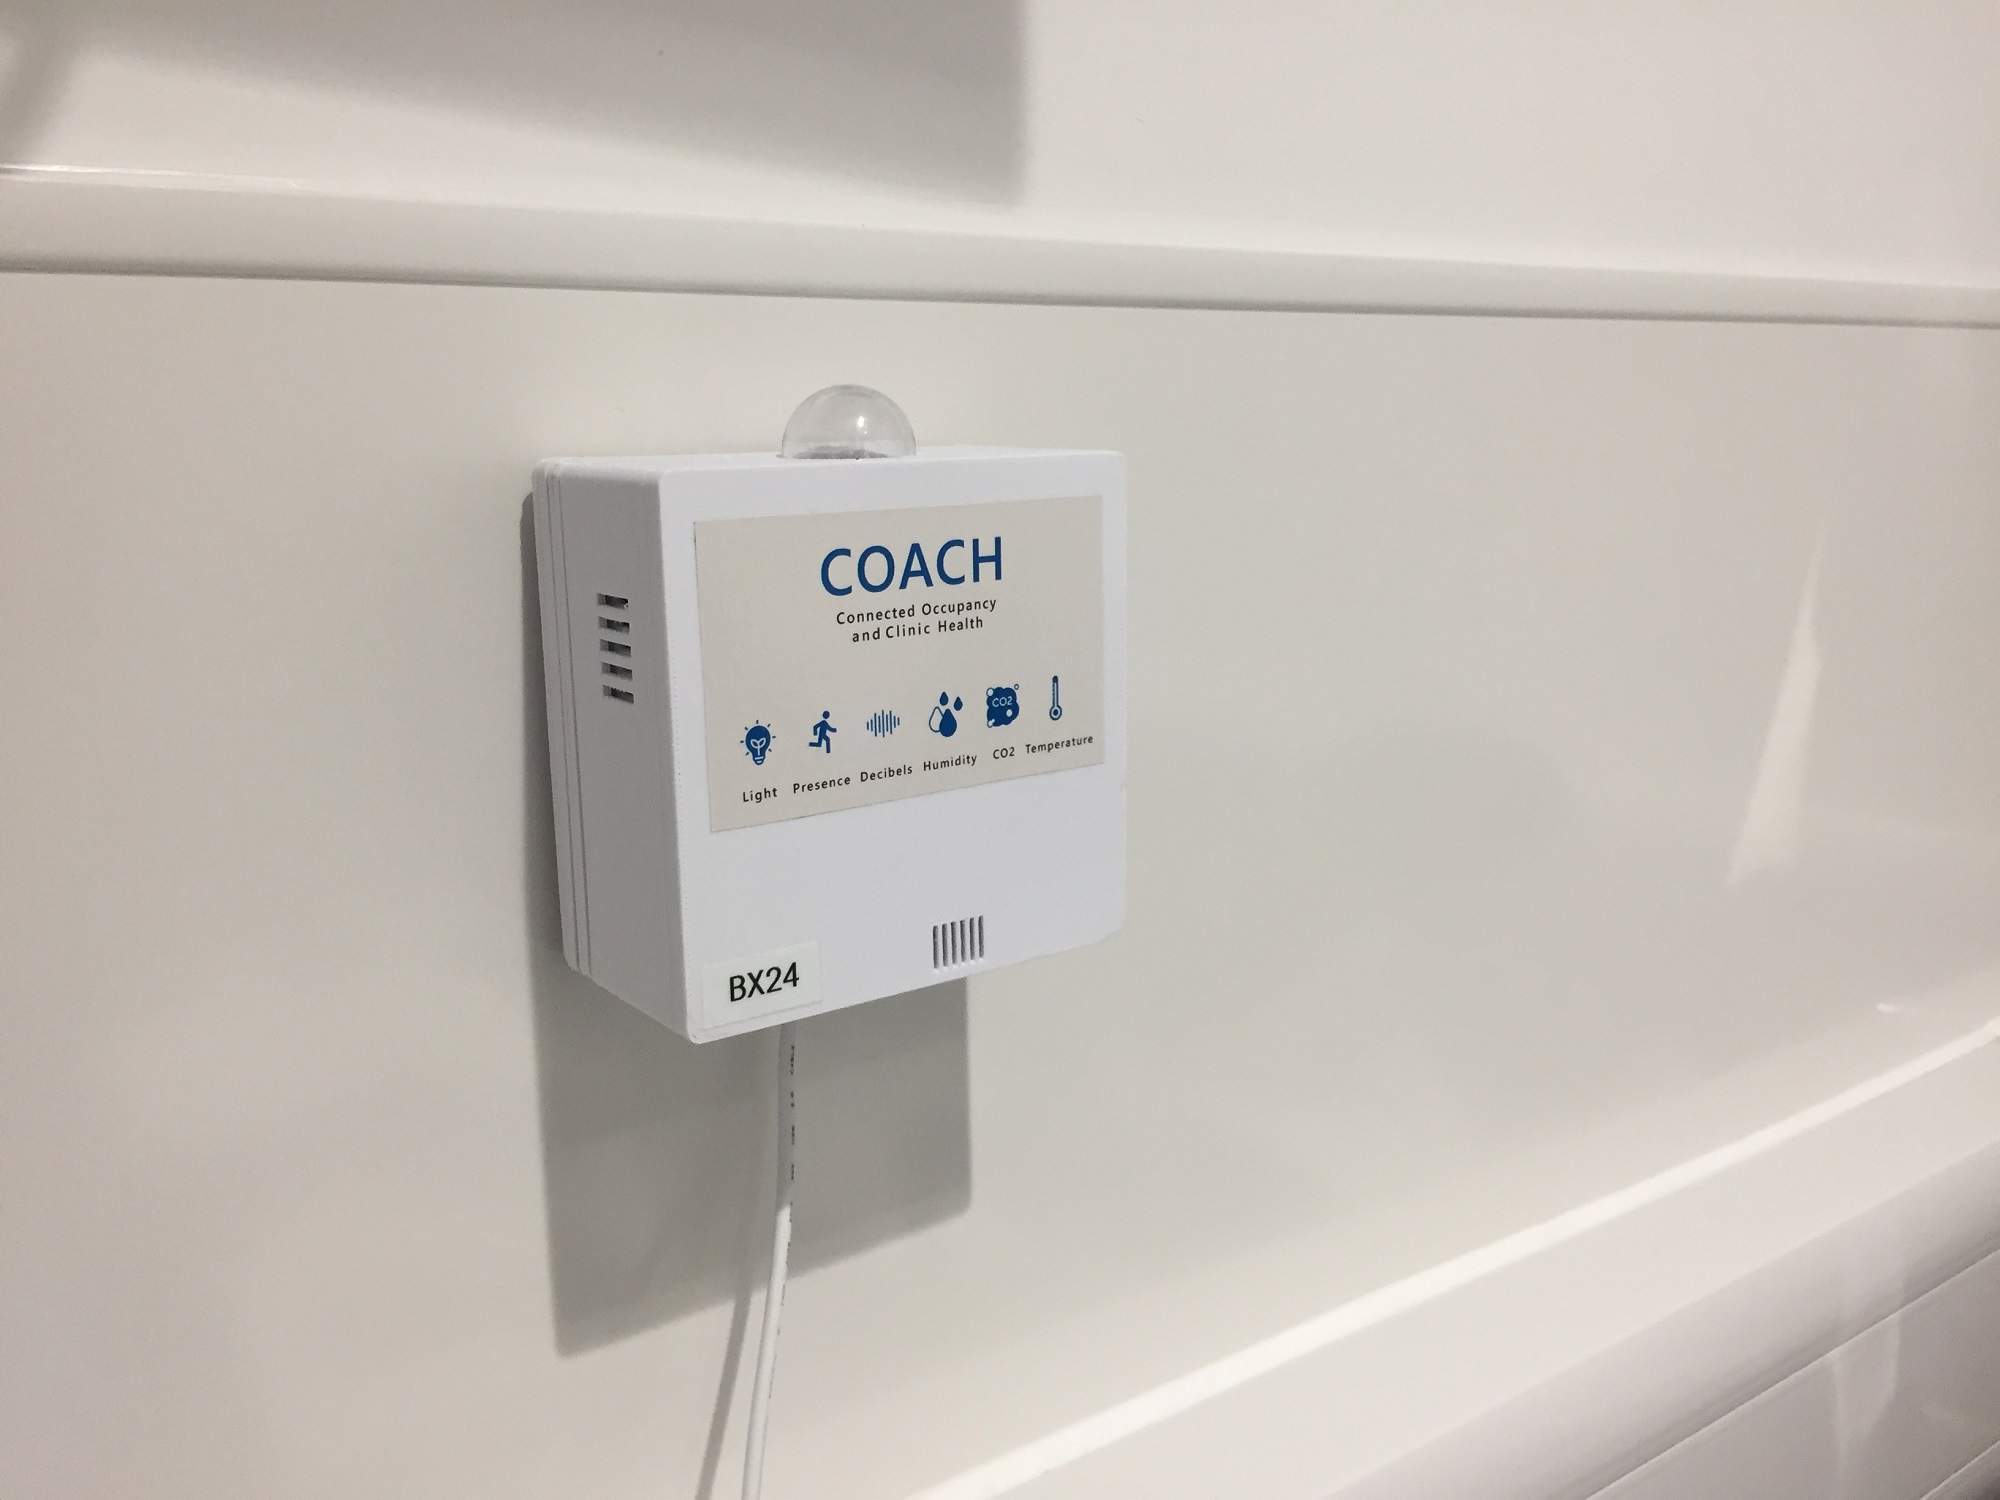
Sensor Composition
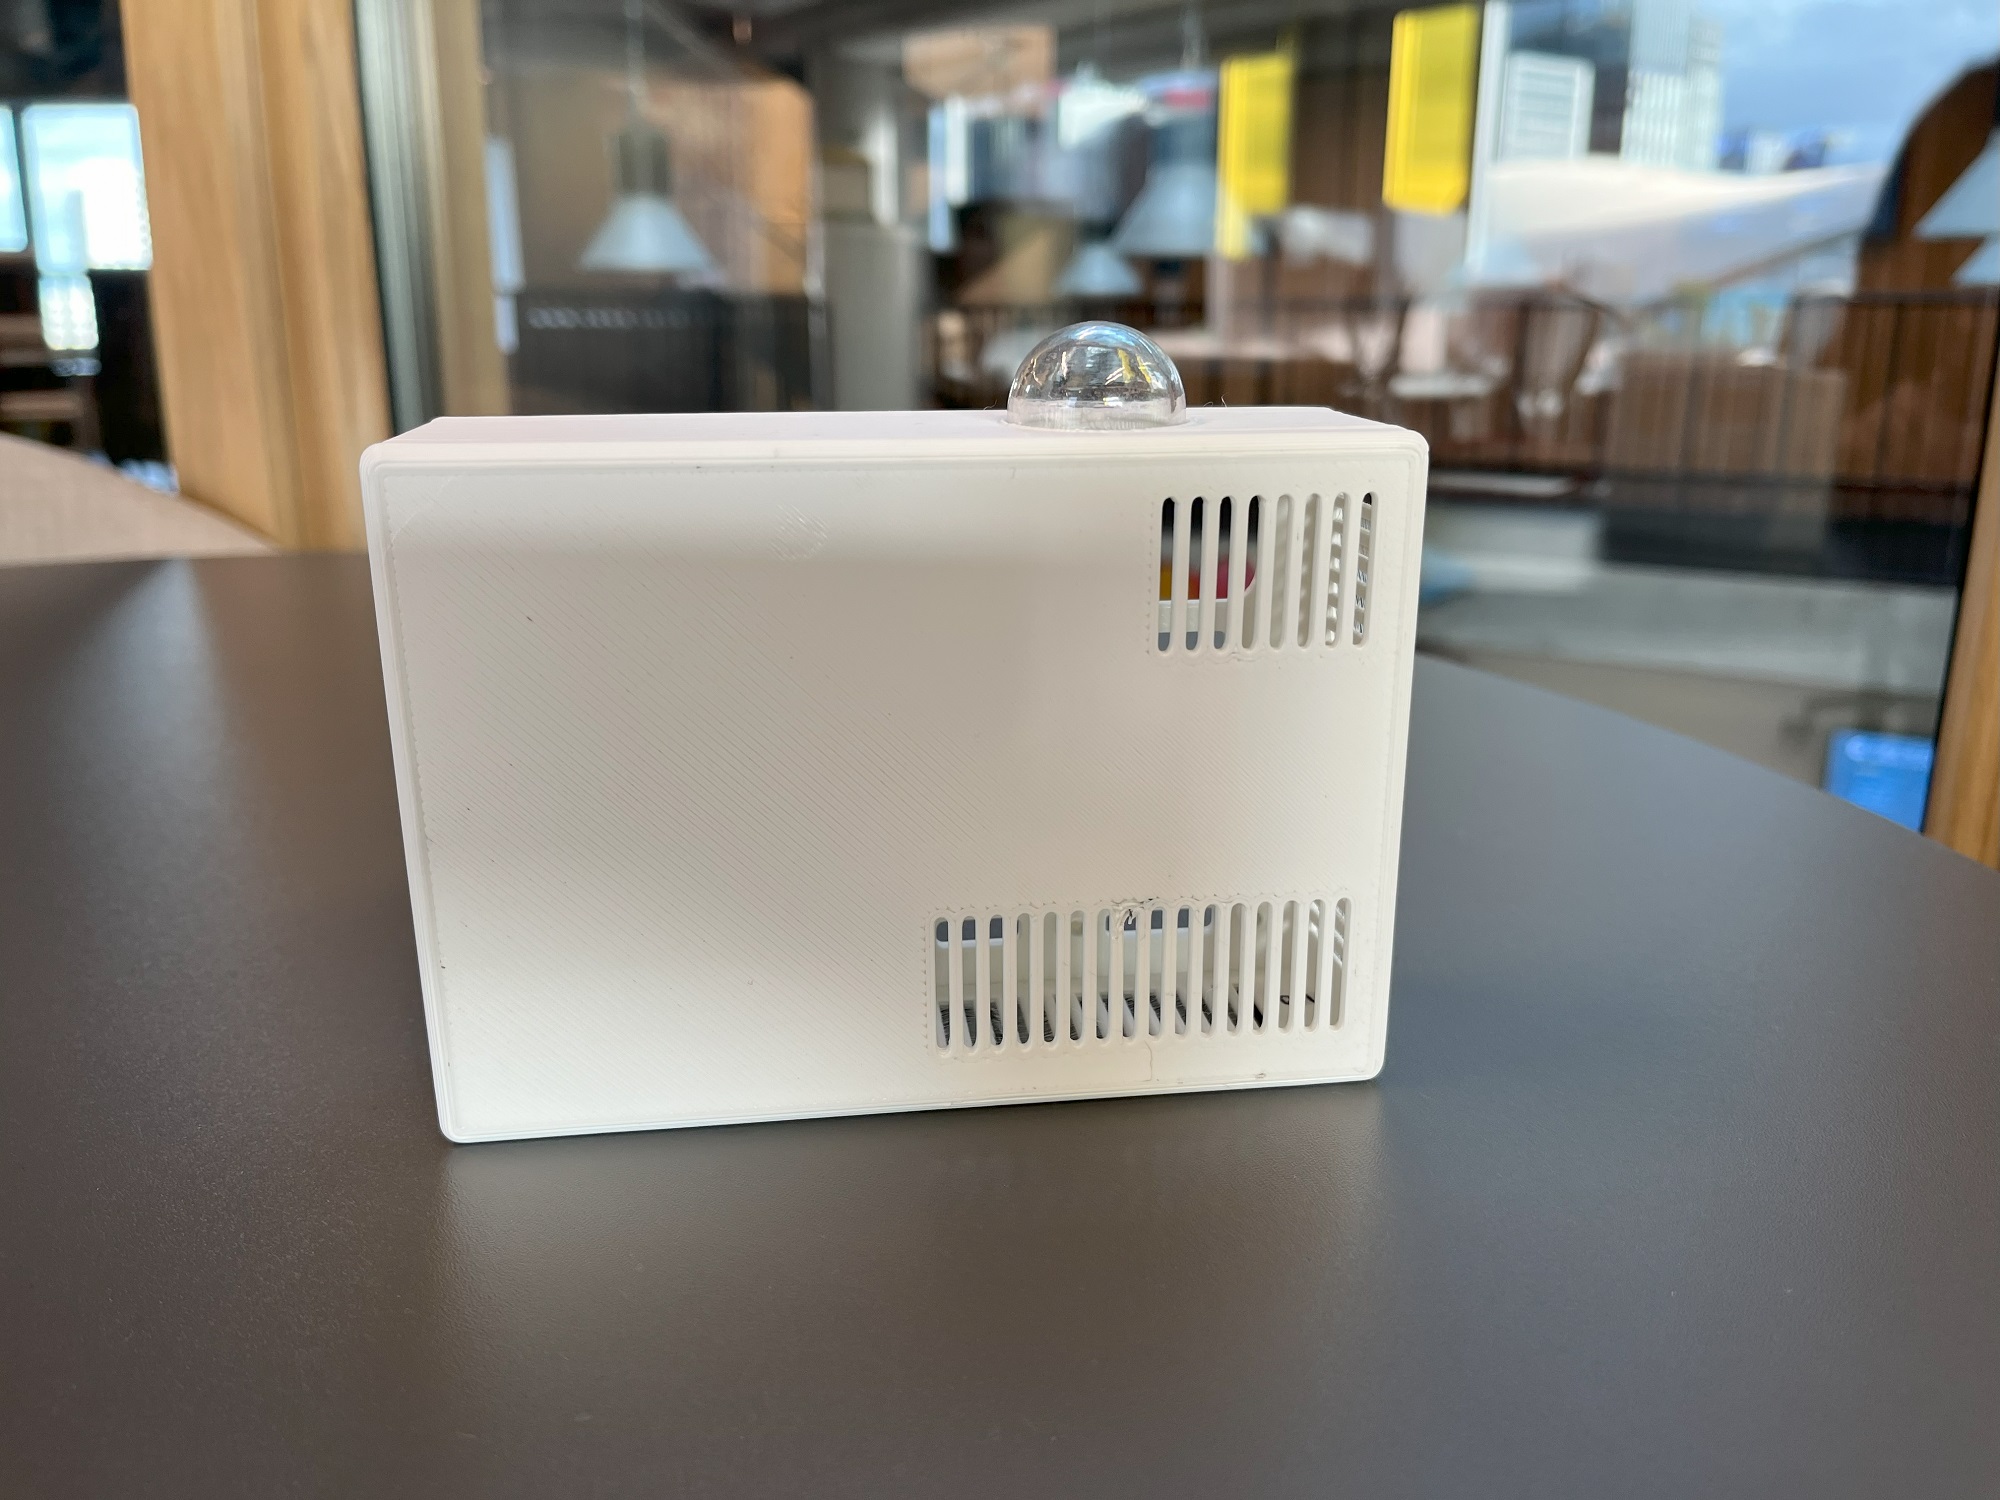
The COACH unit is a collection of sensors that is designed to monitor various environmental parameters and occupancy at the cubicle level. Each COACH unit comprises of the following sensors:
- CO2 Sensor
- Temperature and Humidity Sensor
- Light Sensor
- Sound Level Sensor
- Millimeter Wave Radar for Occupancy Detection
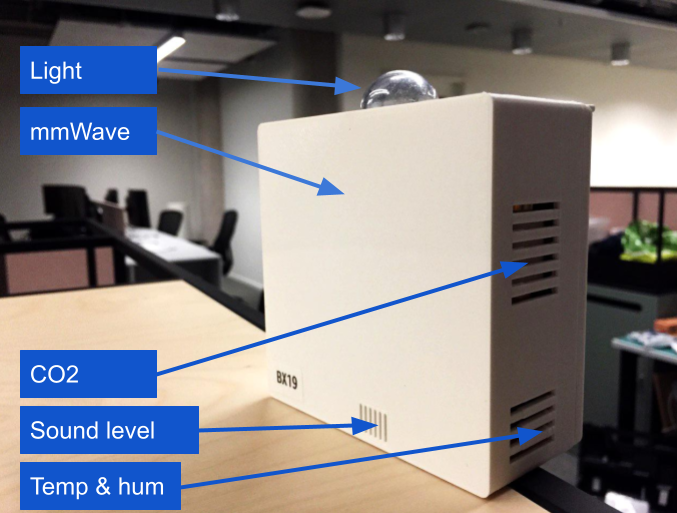
The sensors used in the COACH and their positions
Sensor Rationale
Each sensor in the COACH unit was selected based on specific criteria and objectives to enhance clinic operations:
1. CO2 Sensor (unit: ppm)
The rationale behind including a CO2 sensor was to monitor how CO2 accumulates in each cubicle and how the clinic’s layout affects ventilation and air quality. High CO2 levels could be influenced by factors such as closed curtains, high occupancy, or prolonged use of a cubicle. Understanding these dynamics helps in optimising the clinic’s air quality and ventilation systems.
2. Temperature and Humidity Sensor (units: celsius and %RH)
Monitoring temperature and humidity is useful to understand the behaviour of environmental conditions within the clinic. Identifying which cubicles heat up or cool down faster and how the HVAC system performs across different areas can help in managing patient comfort and equipment efficiency. Peak temperature times and humidity levels are also important for maintaining optimal conditions for both patients and sensitive medical equipment.
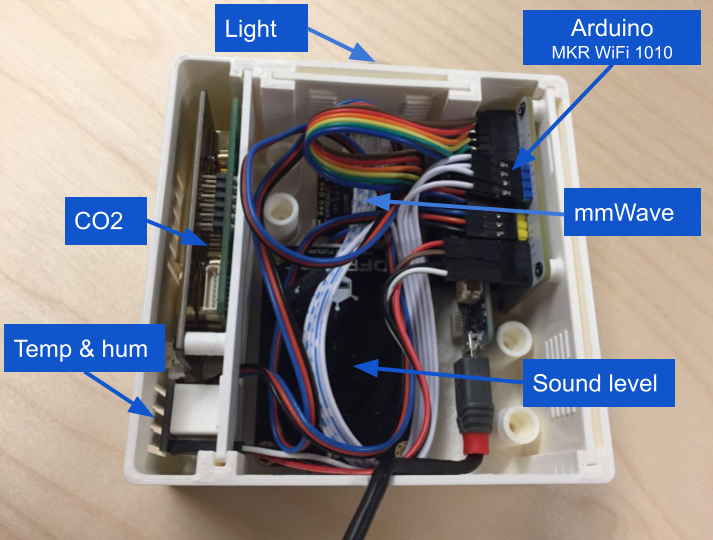
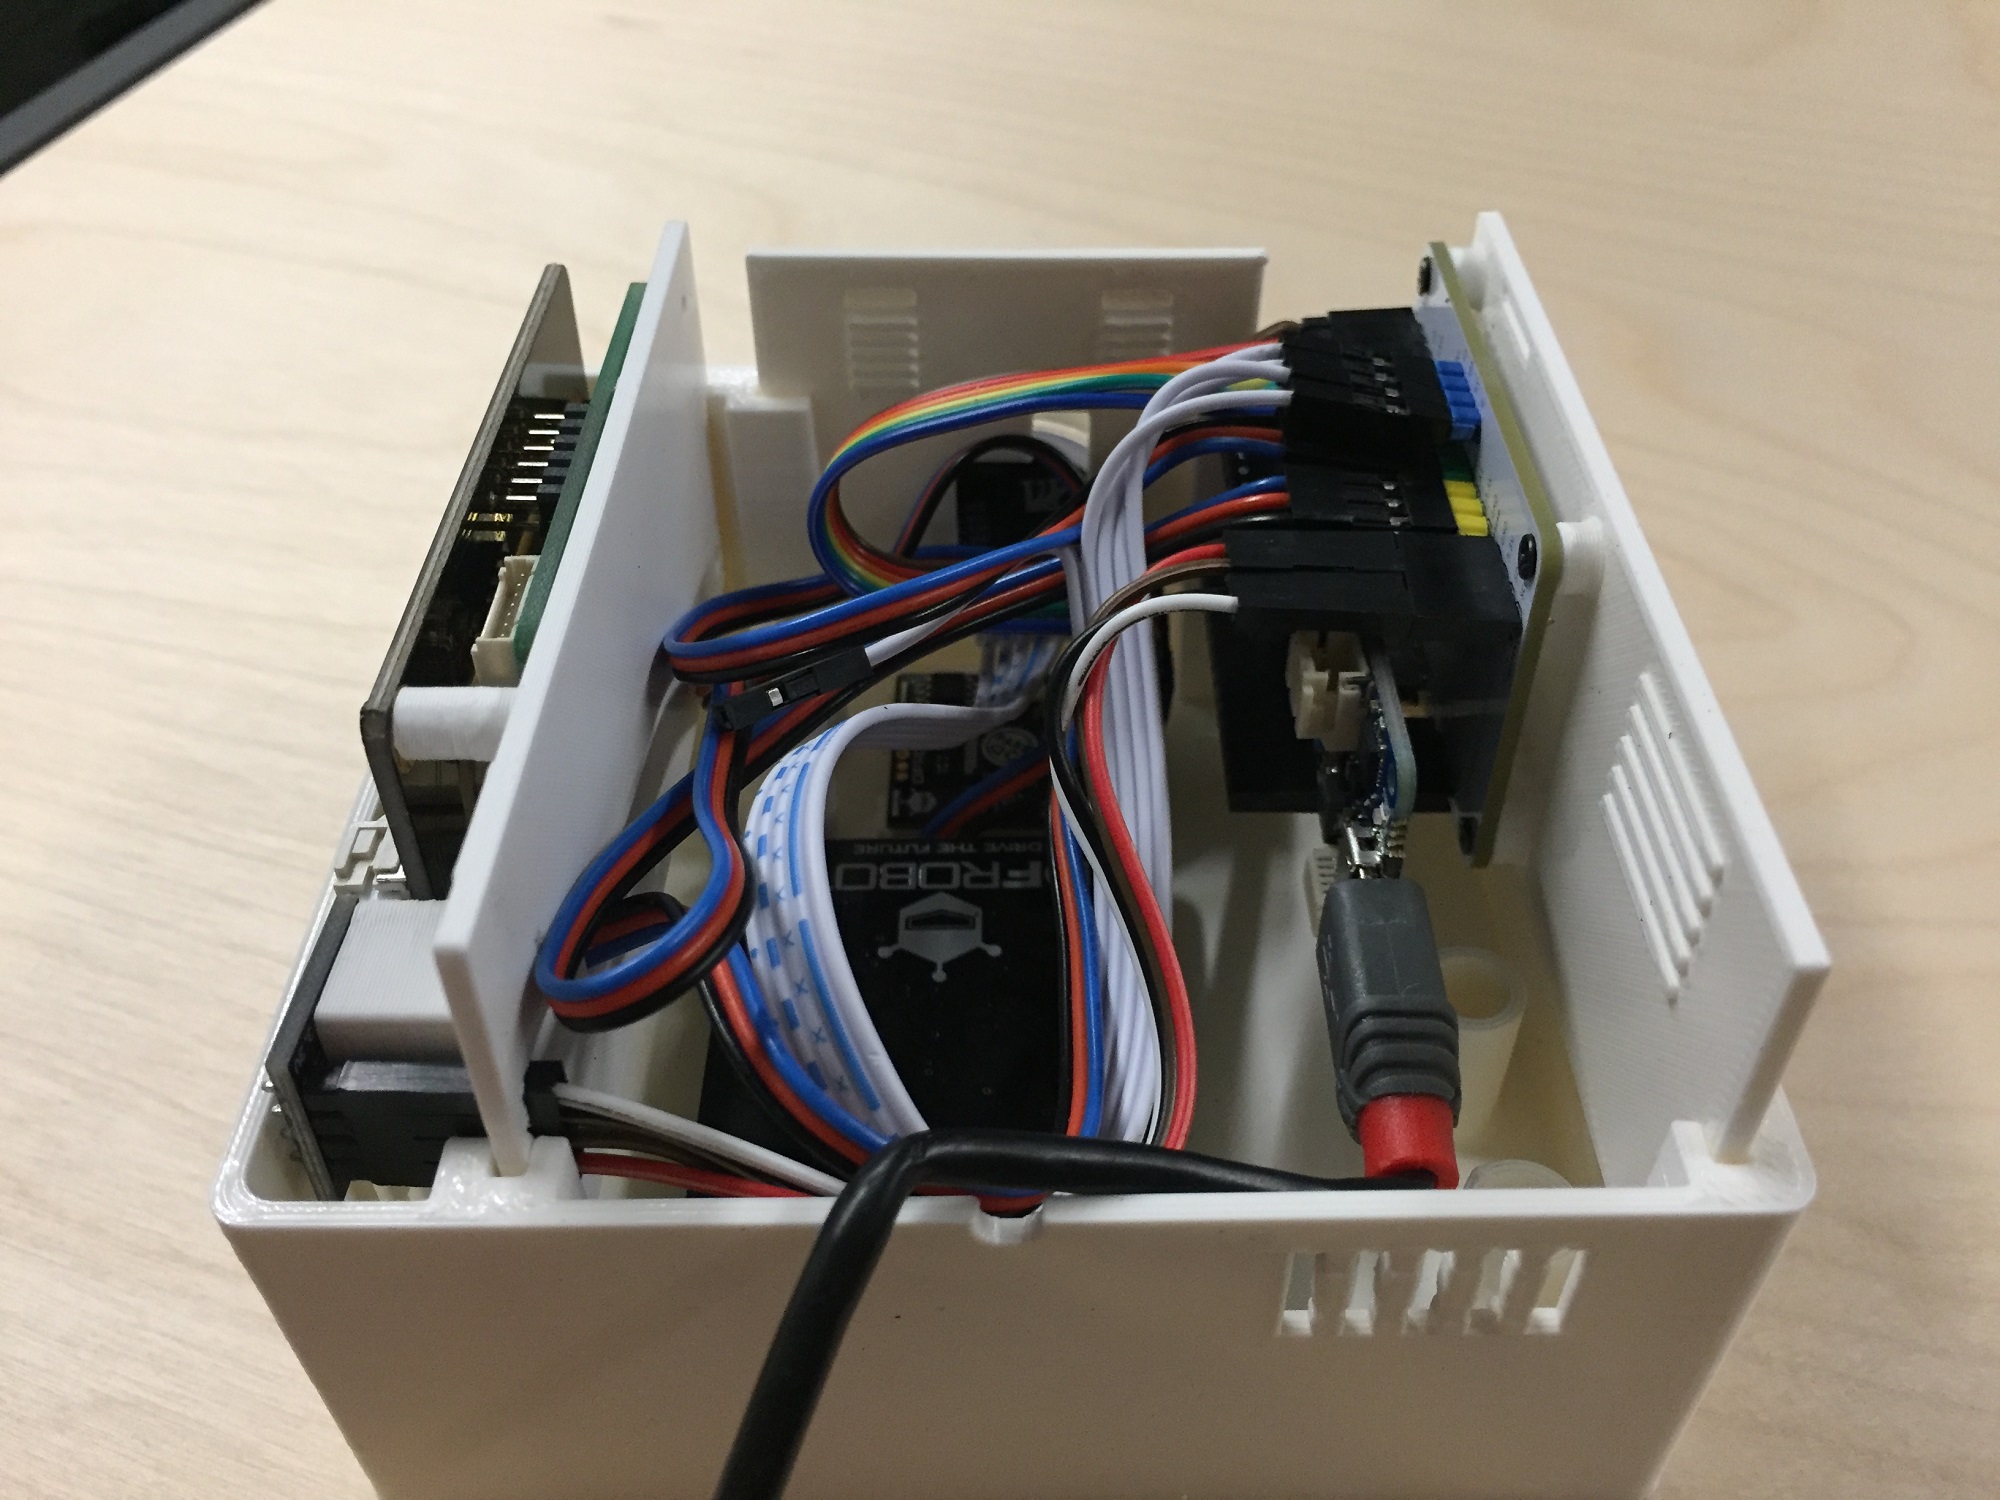
The internal positions of used sensors
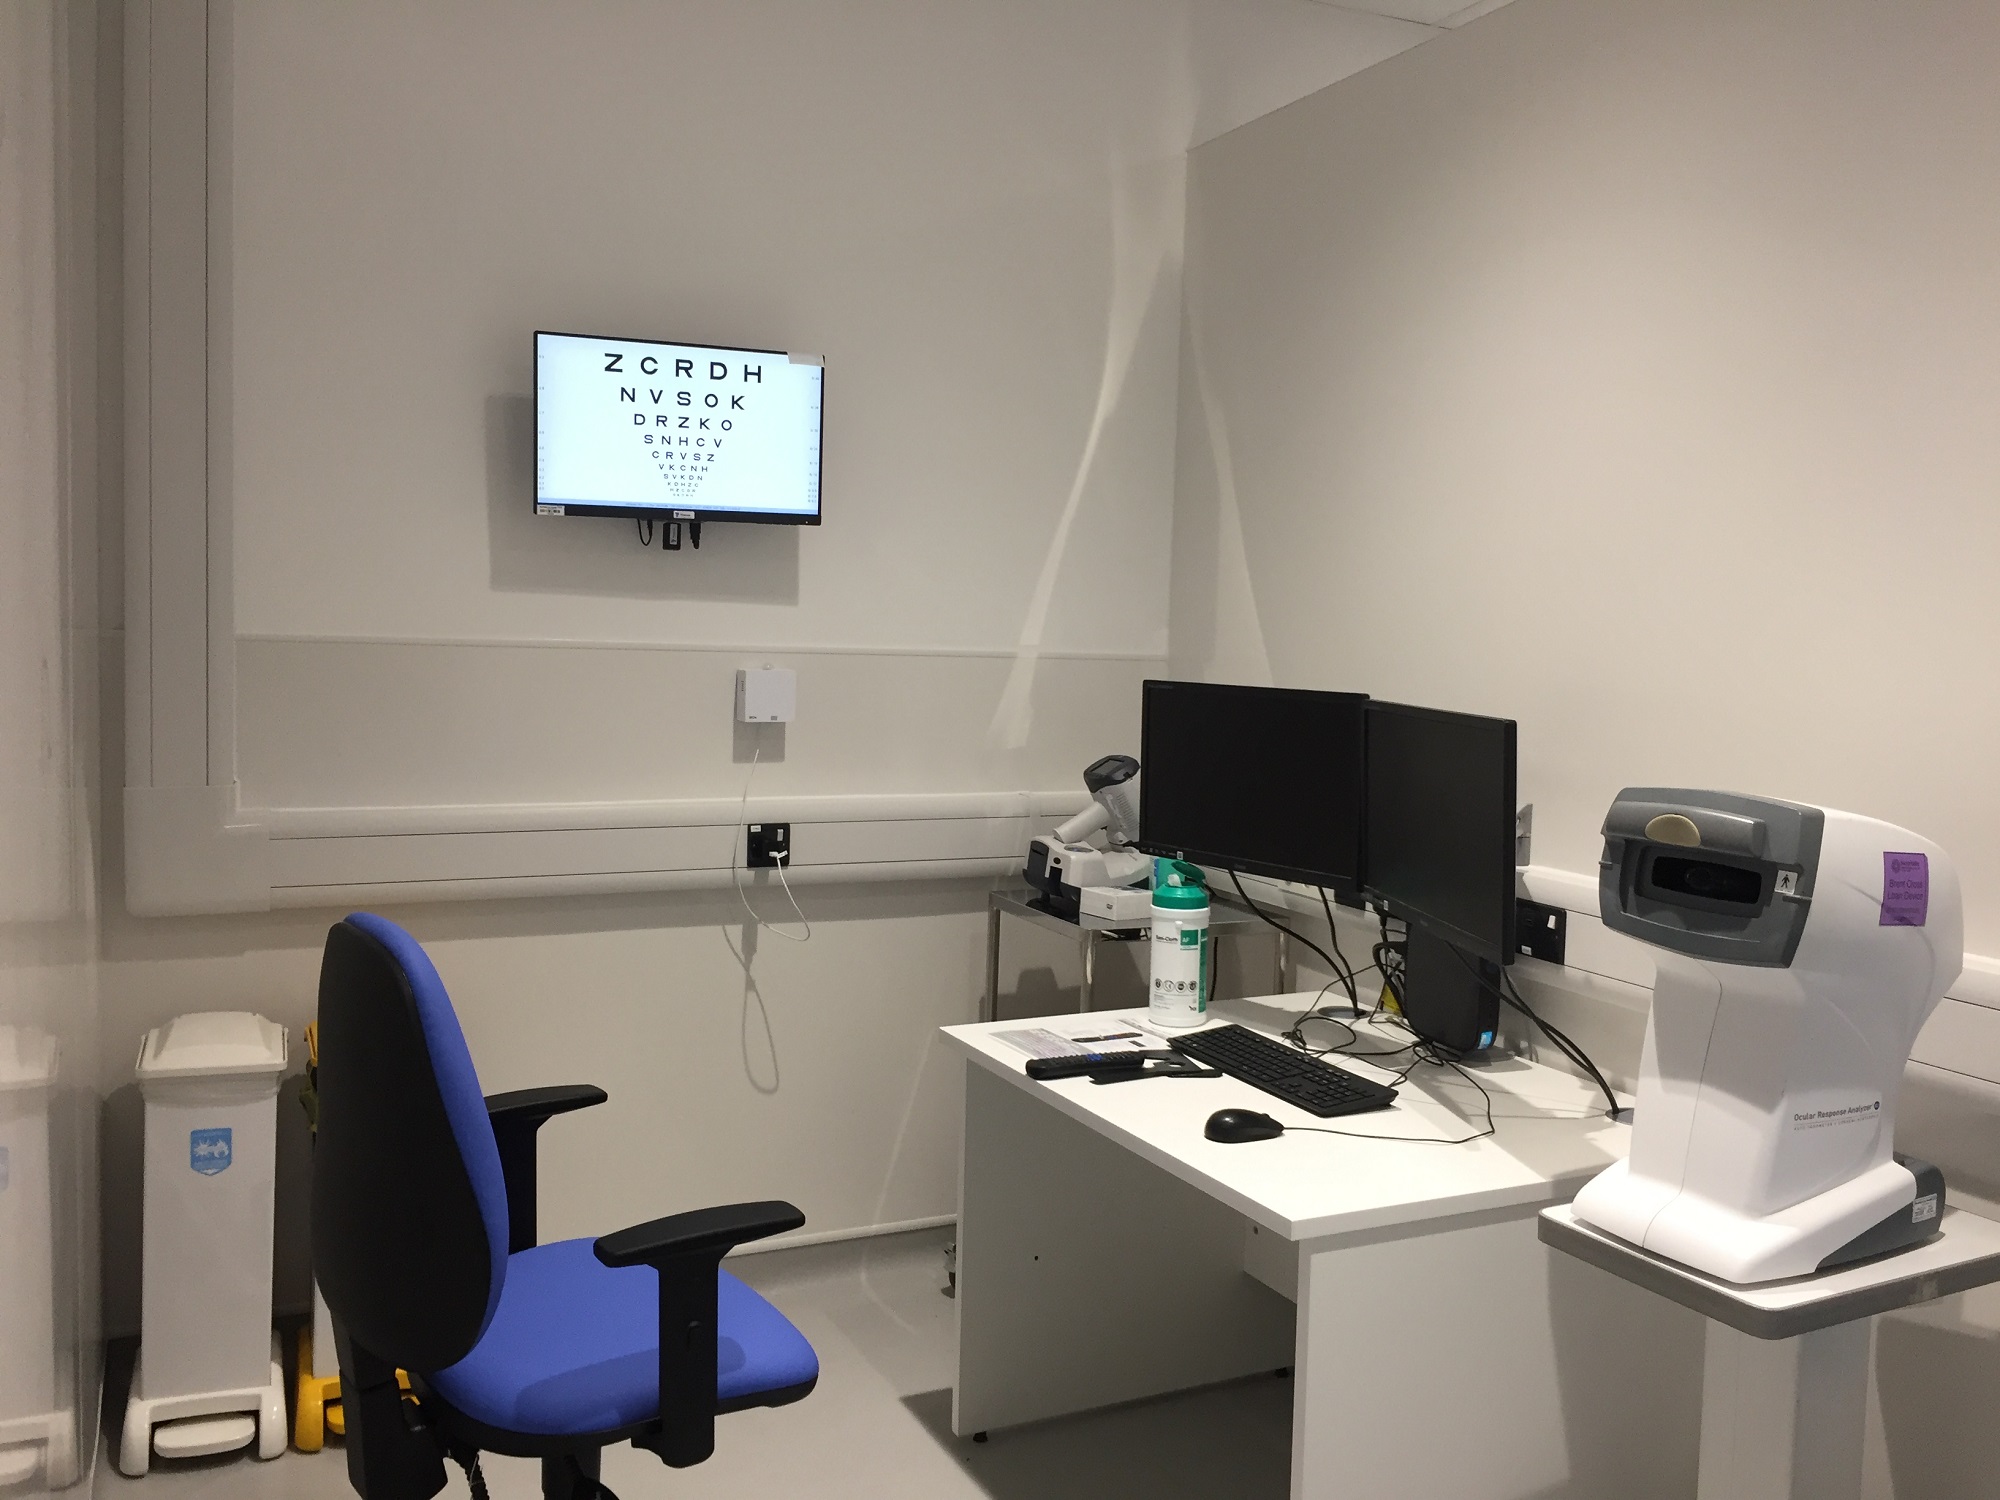
3. Light Sensor (unit: lux)
Light levels within the clinic vary depending on the specific requirements of different cubicles. For instance, visual field testing areas require low light levels, while other areas might need higher lighting conditions. Monitoring light levels helps ensure that each cubicle meets its specific lighting needs, which can improve both patient experience and staff efficiency.
4. Sound Sensor (unit: dBm)
Excessive noise in a clinic can disrupt communication between staff and patients, leading to longer examination times as instructions may need to be repeated especially to elderly people. By monitoring sound levels, it is possible to identify noisy areas and implement measures to reduce noise, thereby improving patient flow and overall clinic efficiency.
5. Millimeter Wave Radar (unit: presence status 0 to 1)
This sensor detects occupancy by sensing movement within a cubicle. Knowing whether a cubicle is occupied helps in managing patient flow and ensuring that no space is left underutilised. This sensor provides essential data for optimising the use of available space within the clinic.
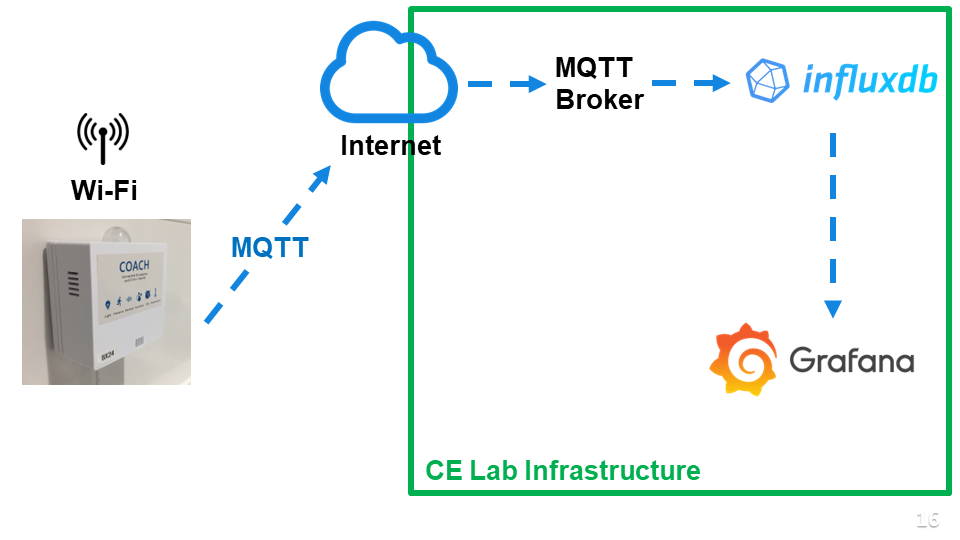
COACH data infrastructure
Design and Development
Initial Prototypes
The initial design and development of the COACH units were led by Duncan, who created the first prototypes using laser-cut plastic and basic 3D-printed boxes. These early versions served as a foundation for further development.


Initial prototypes using laser-cutting and 3D printing
Modular Enclosure Design
When I joined the project, my primary focus was on continuing the enclosure design. The initial design had all the sensors laid out on a single plane, resulting in an inefficient use of space. I redesigned the enclosure to have modular parts that can be printed separately and inserted into the box.
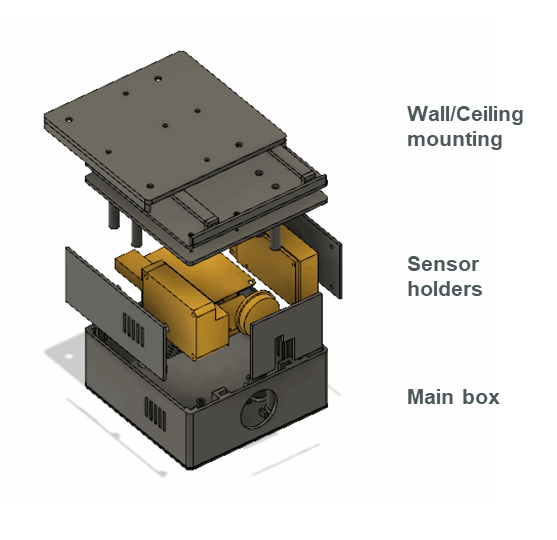
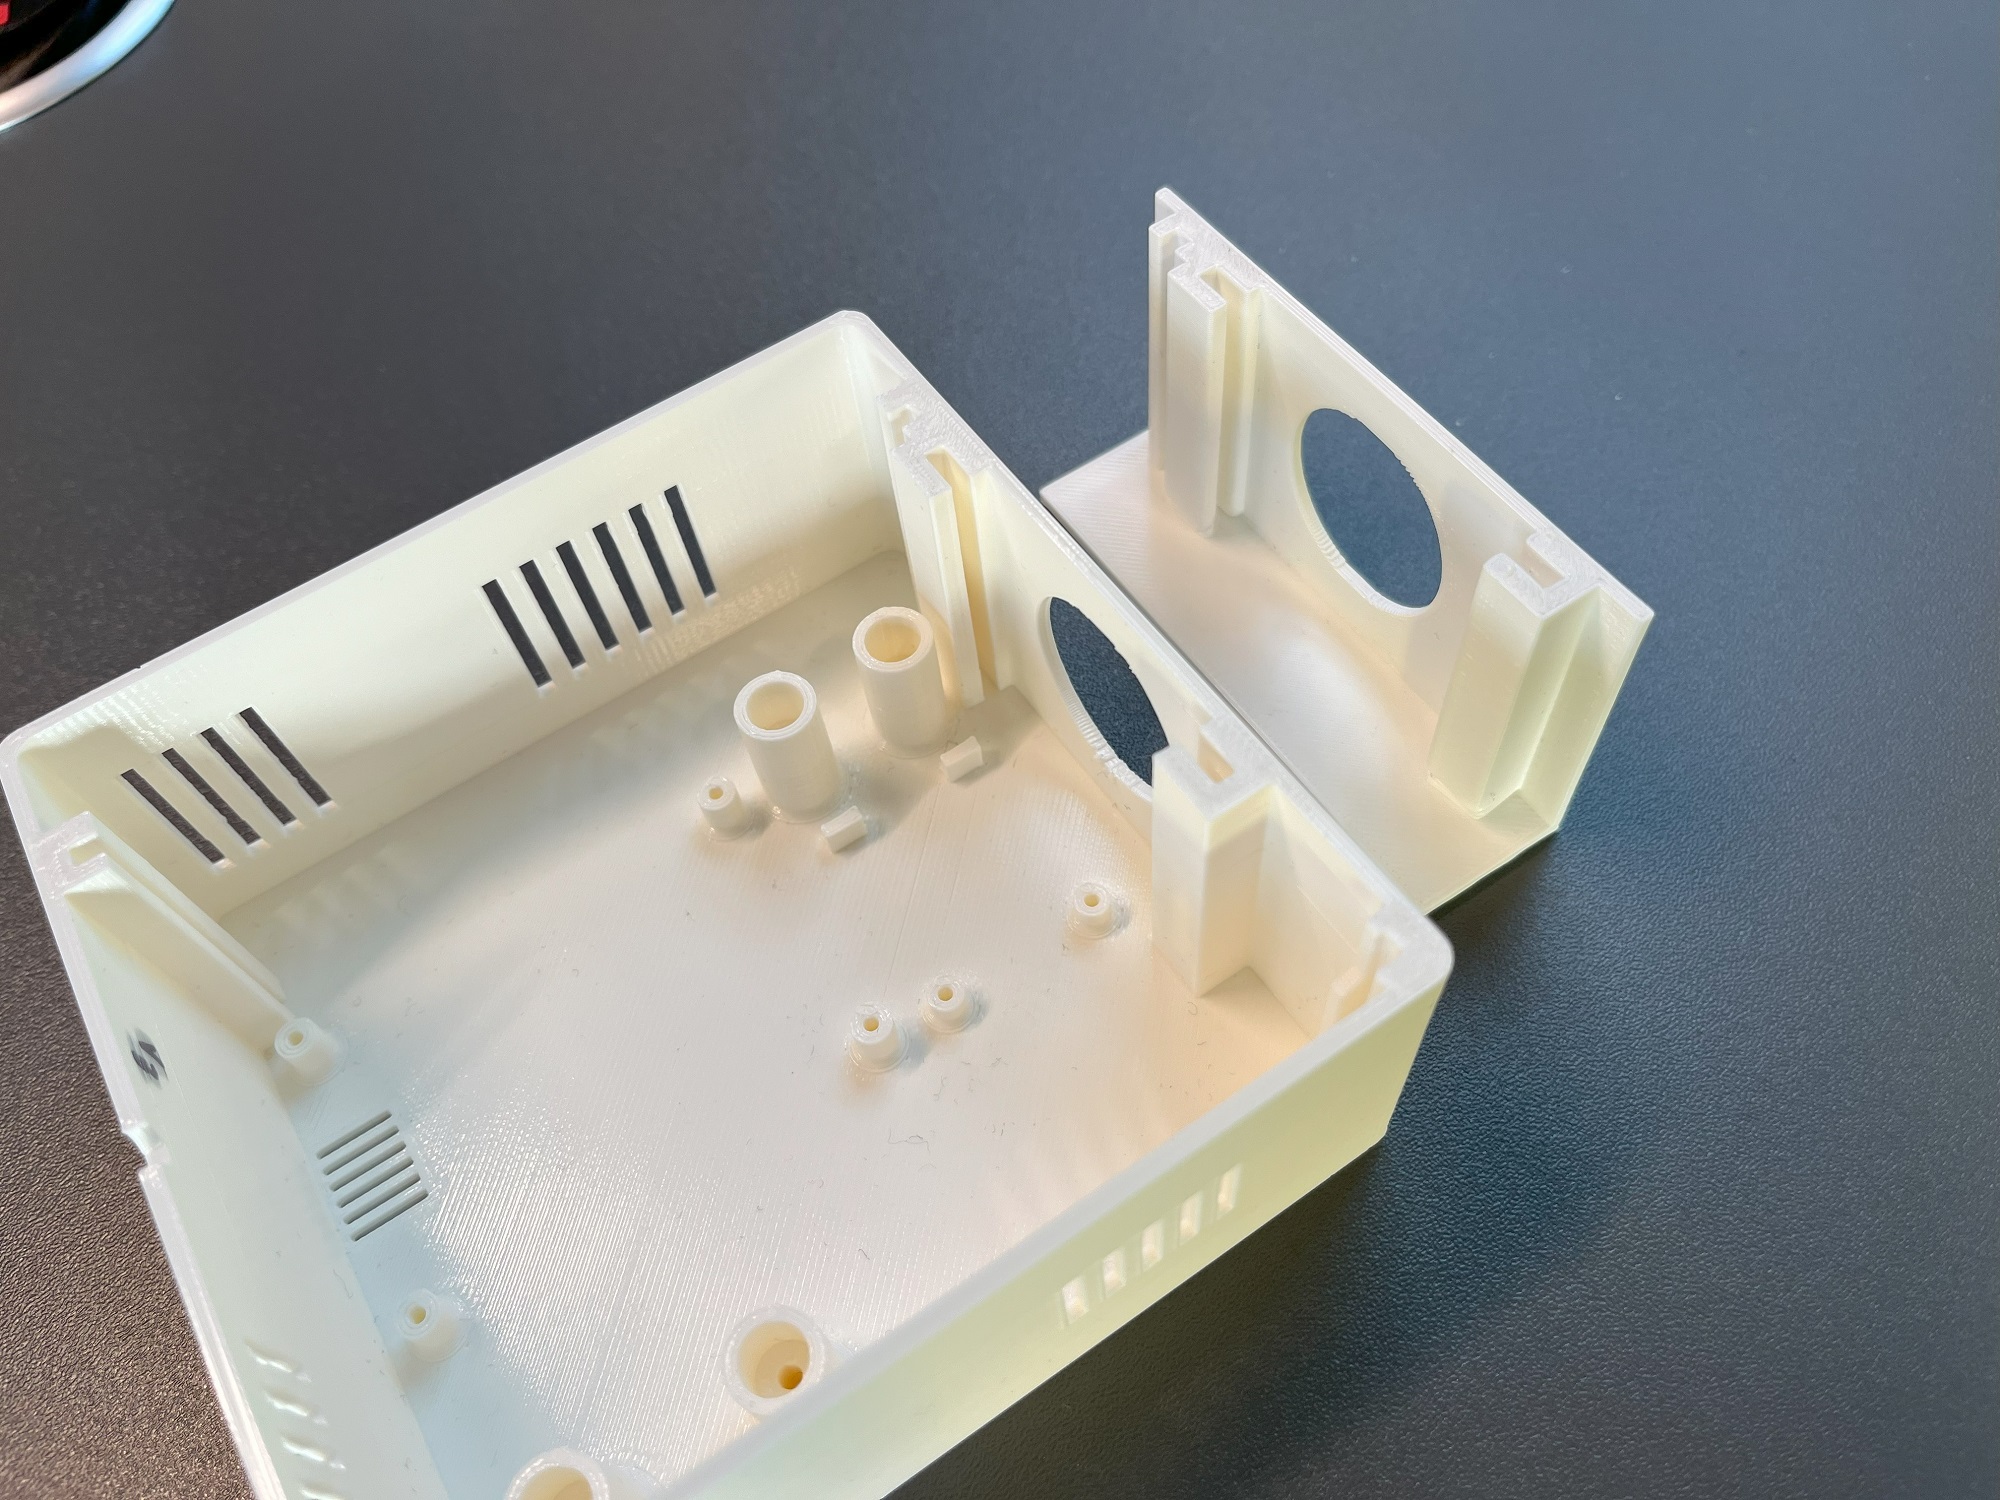
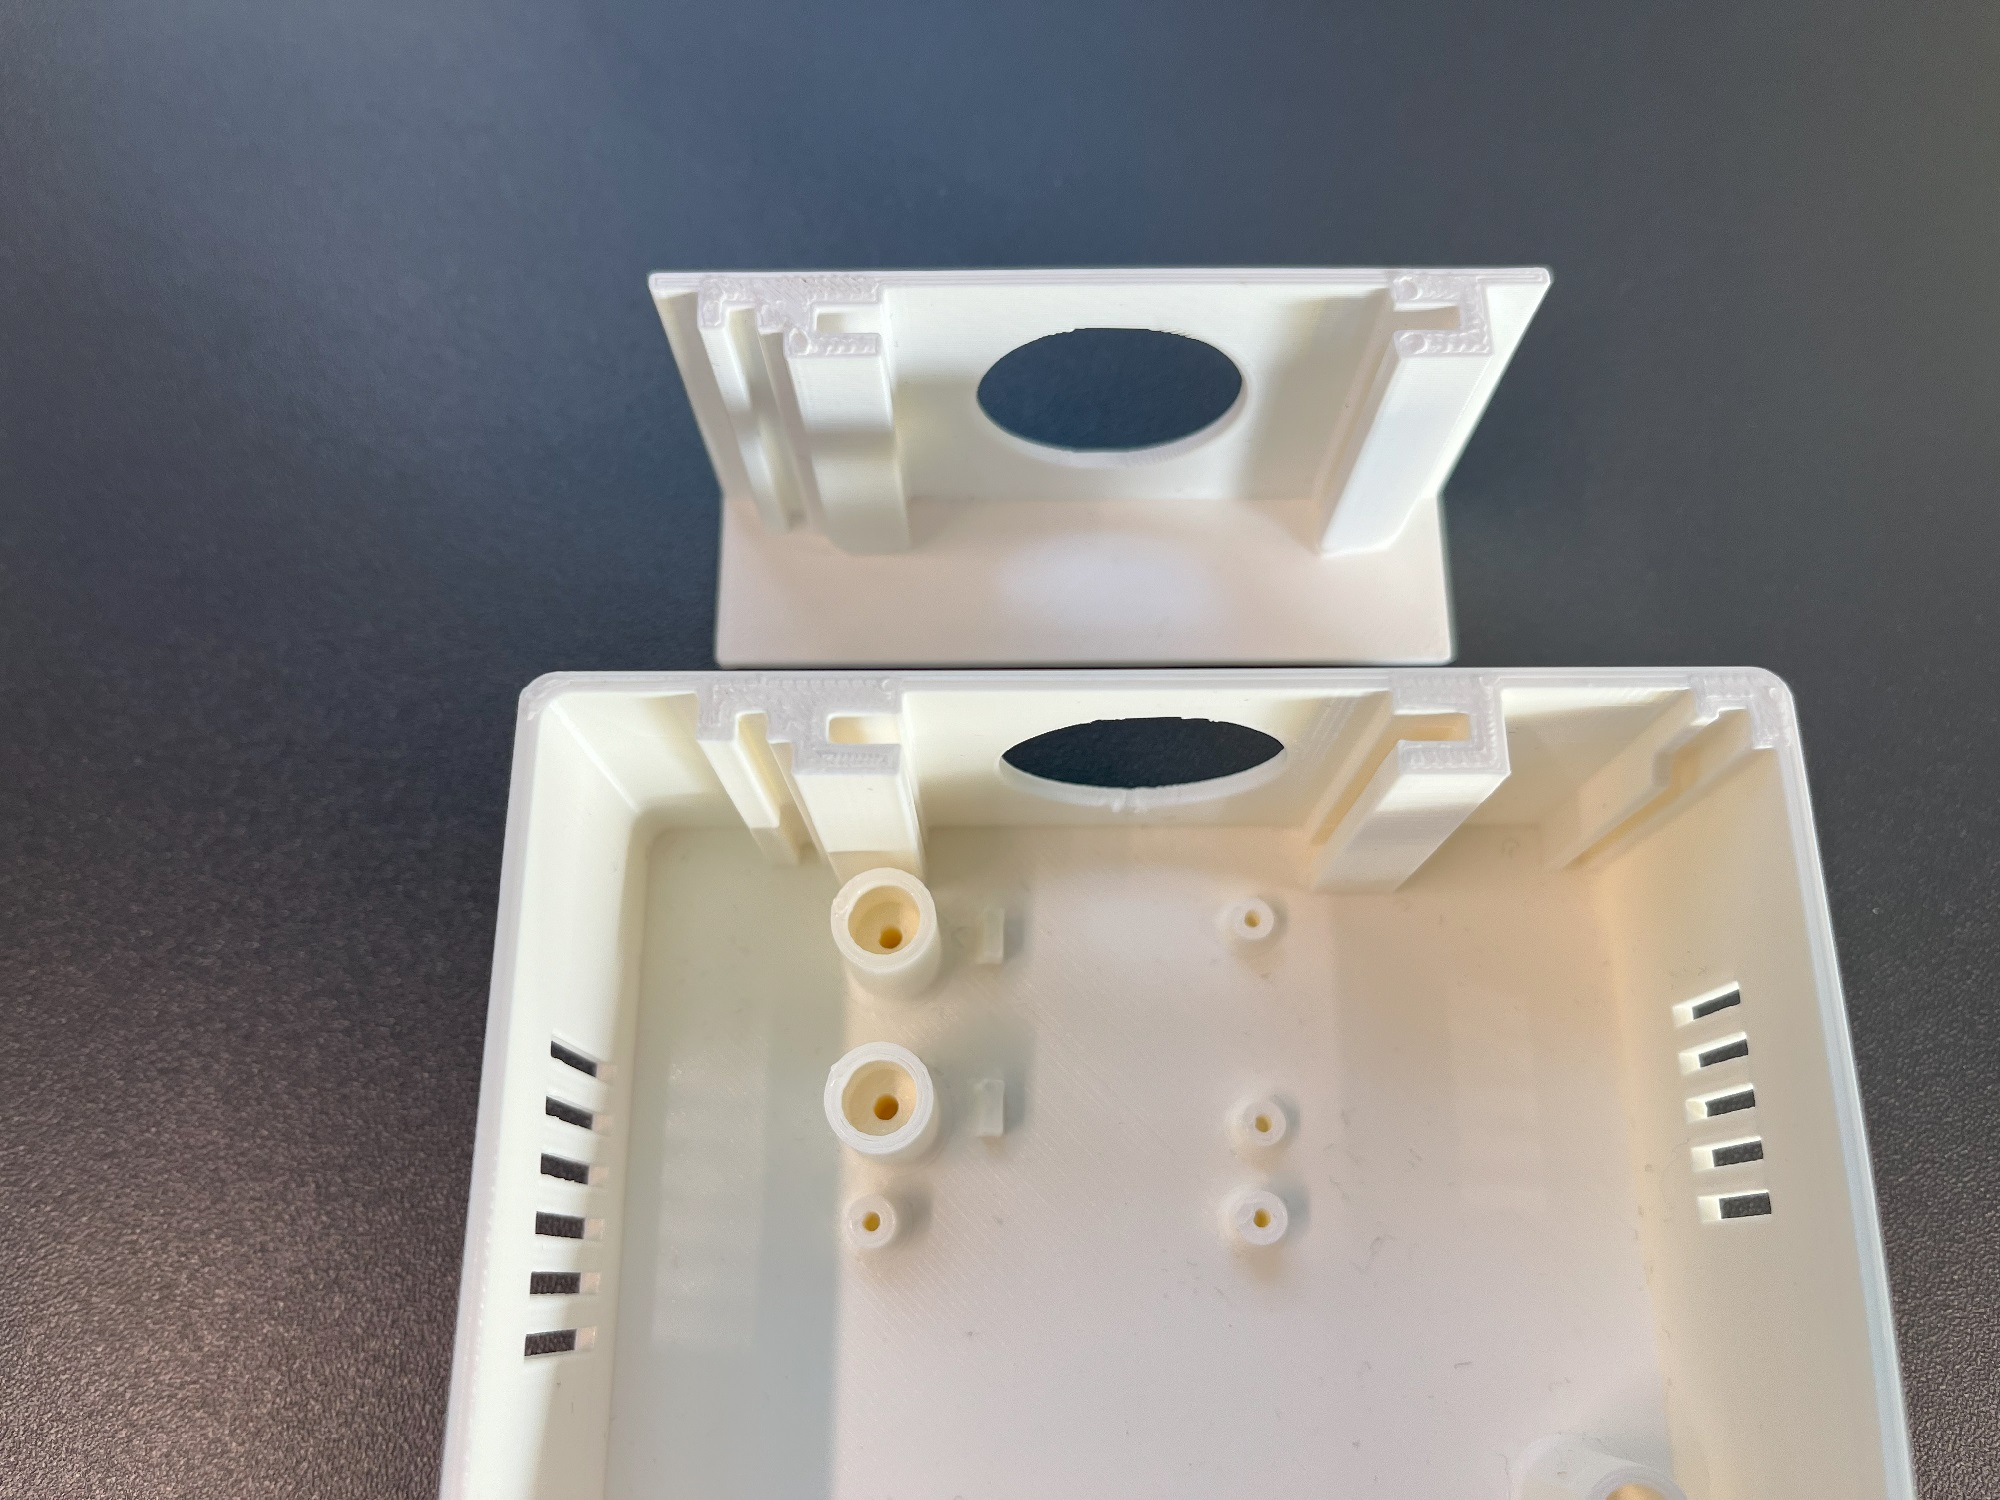
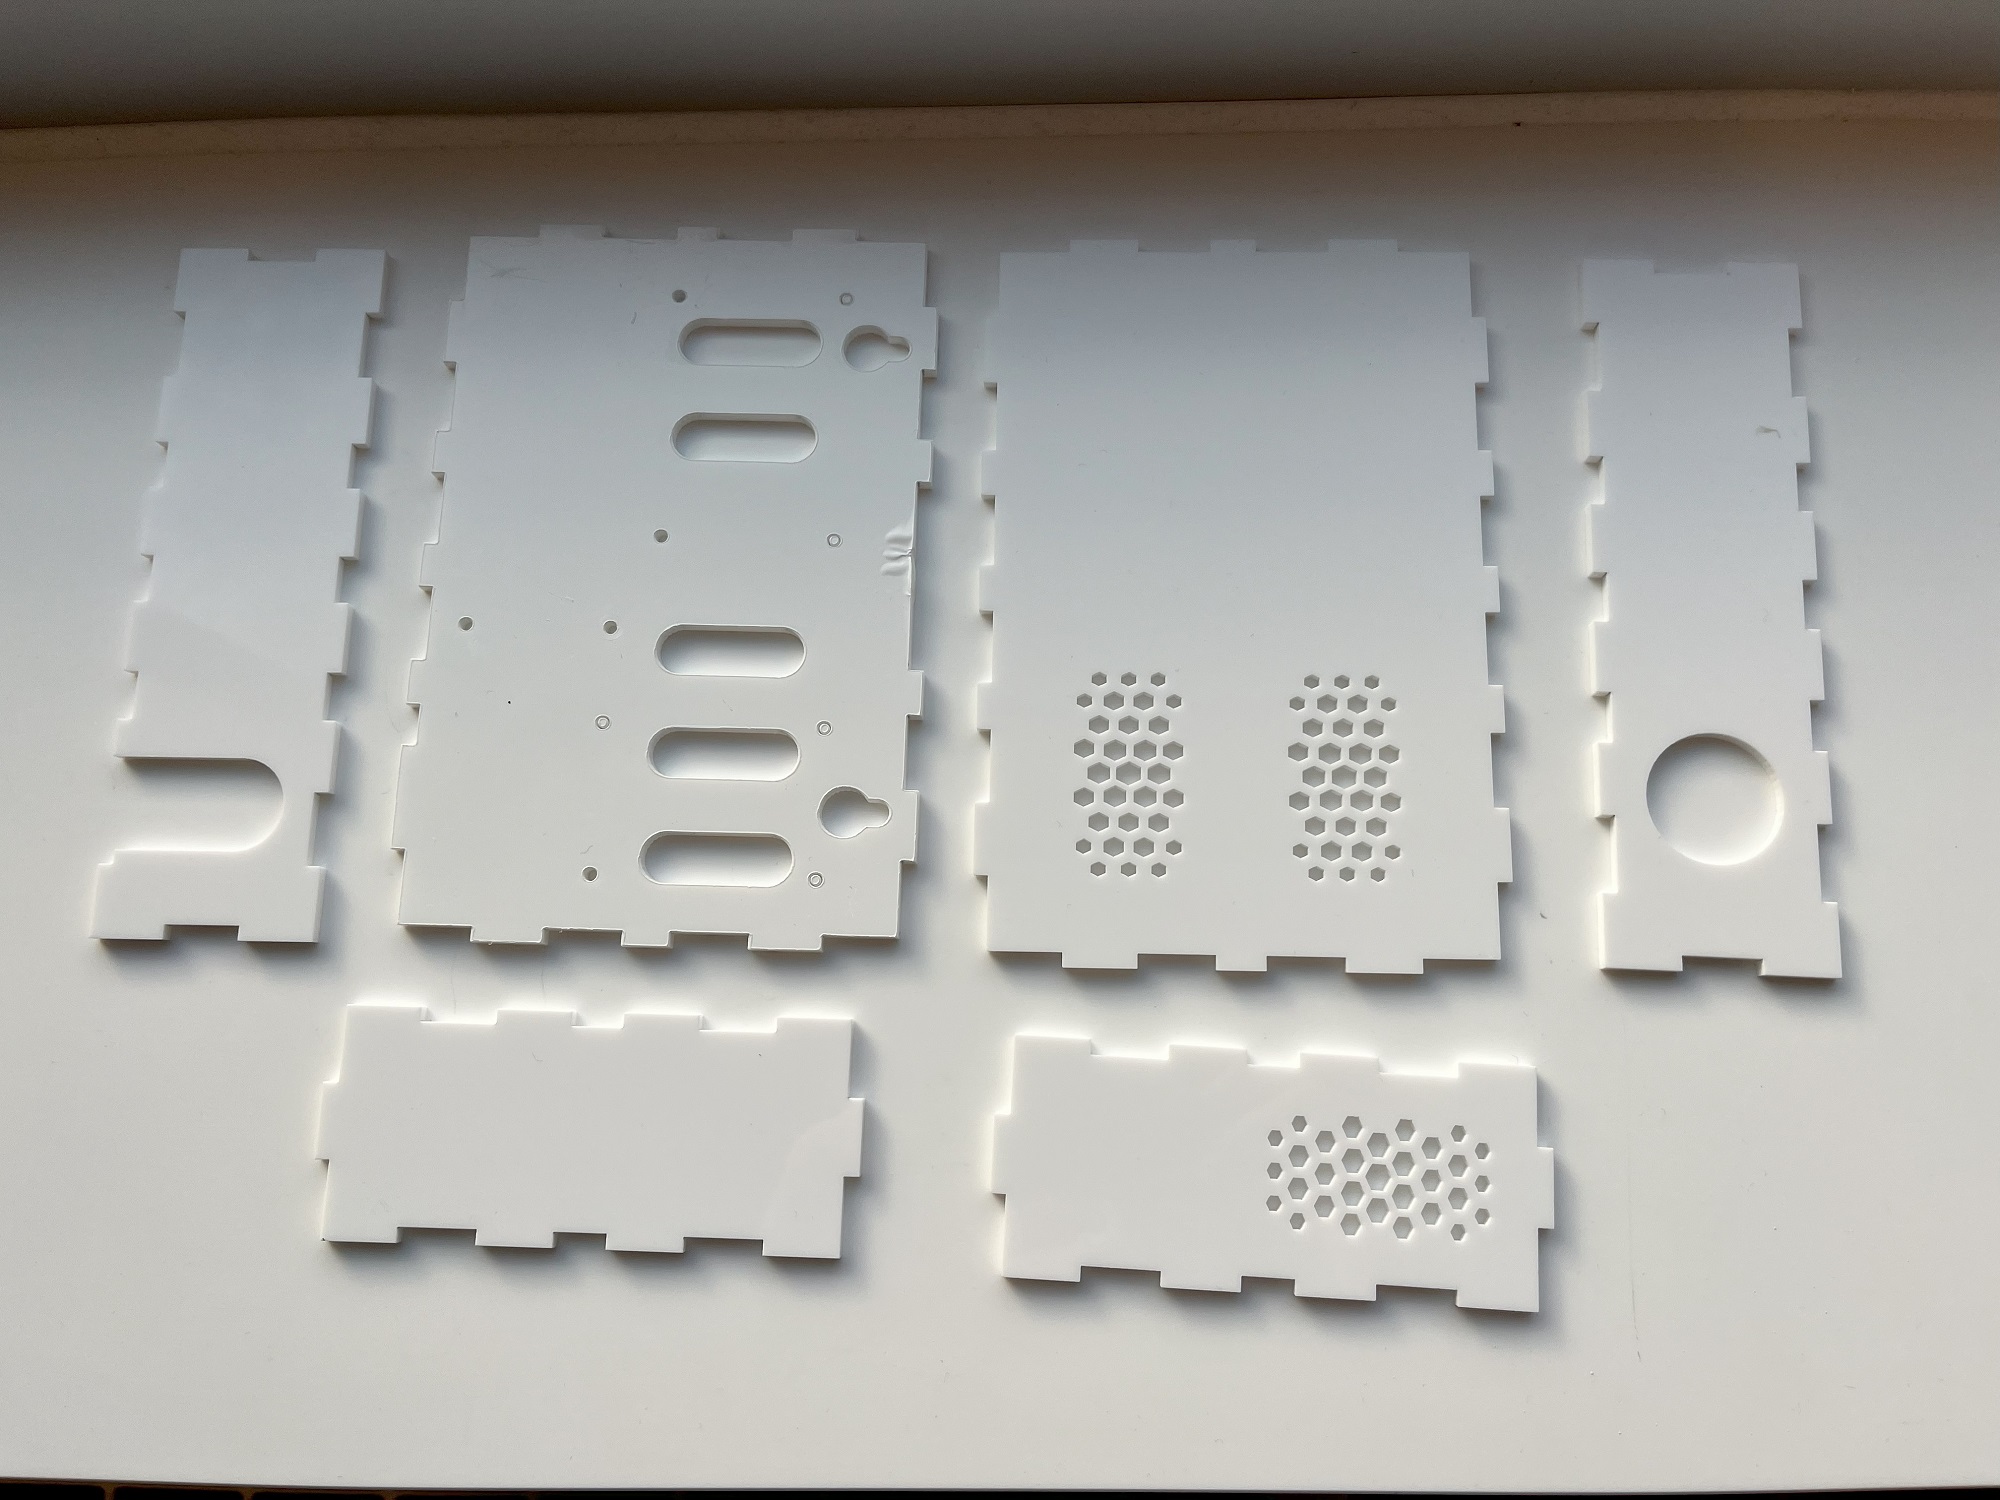
Parts of the COACH device
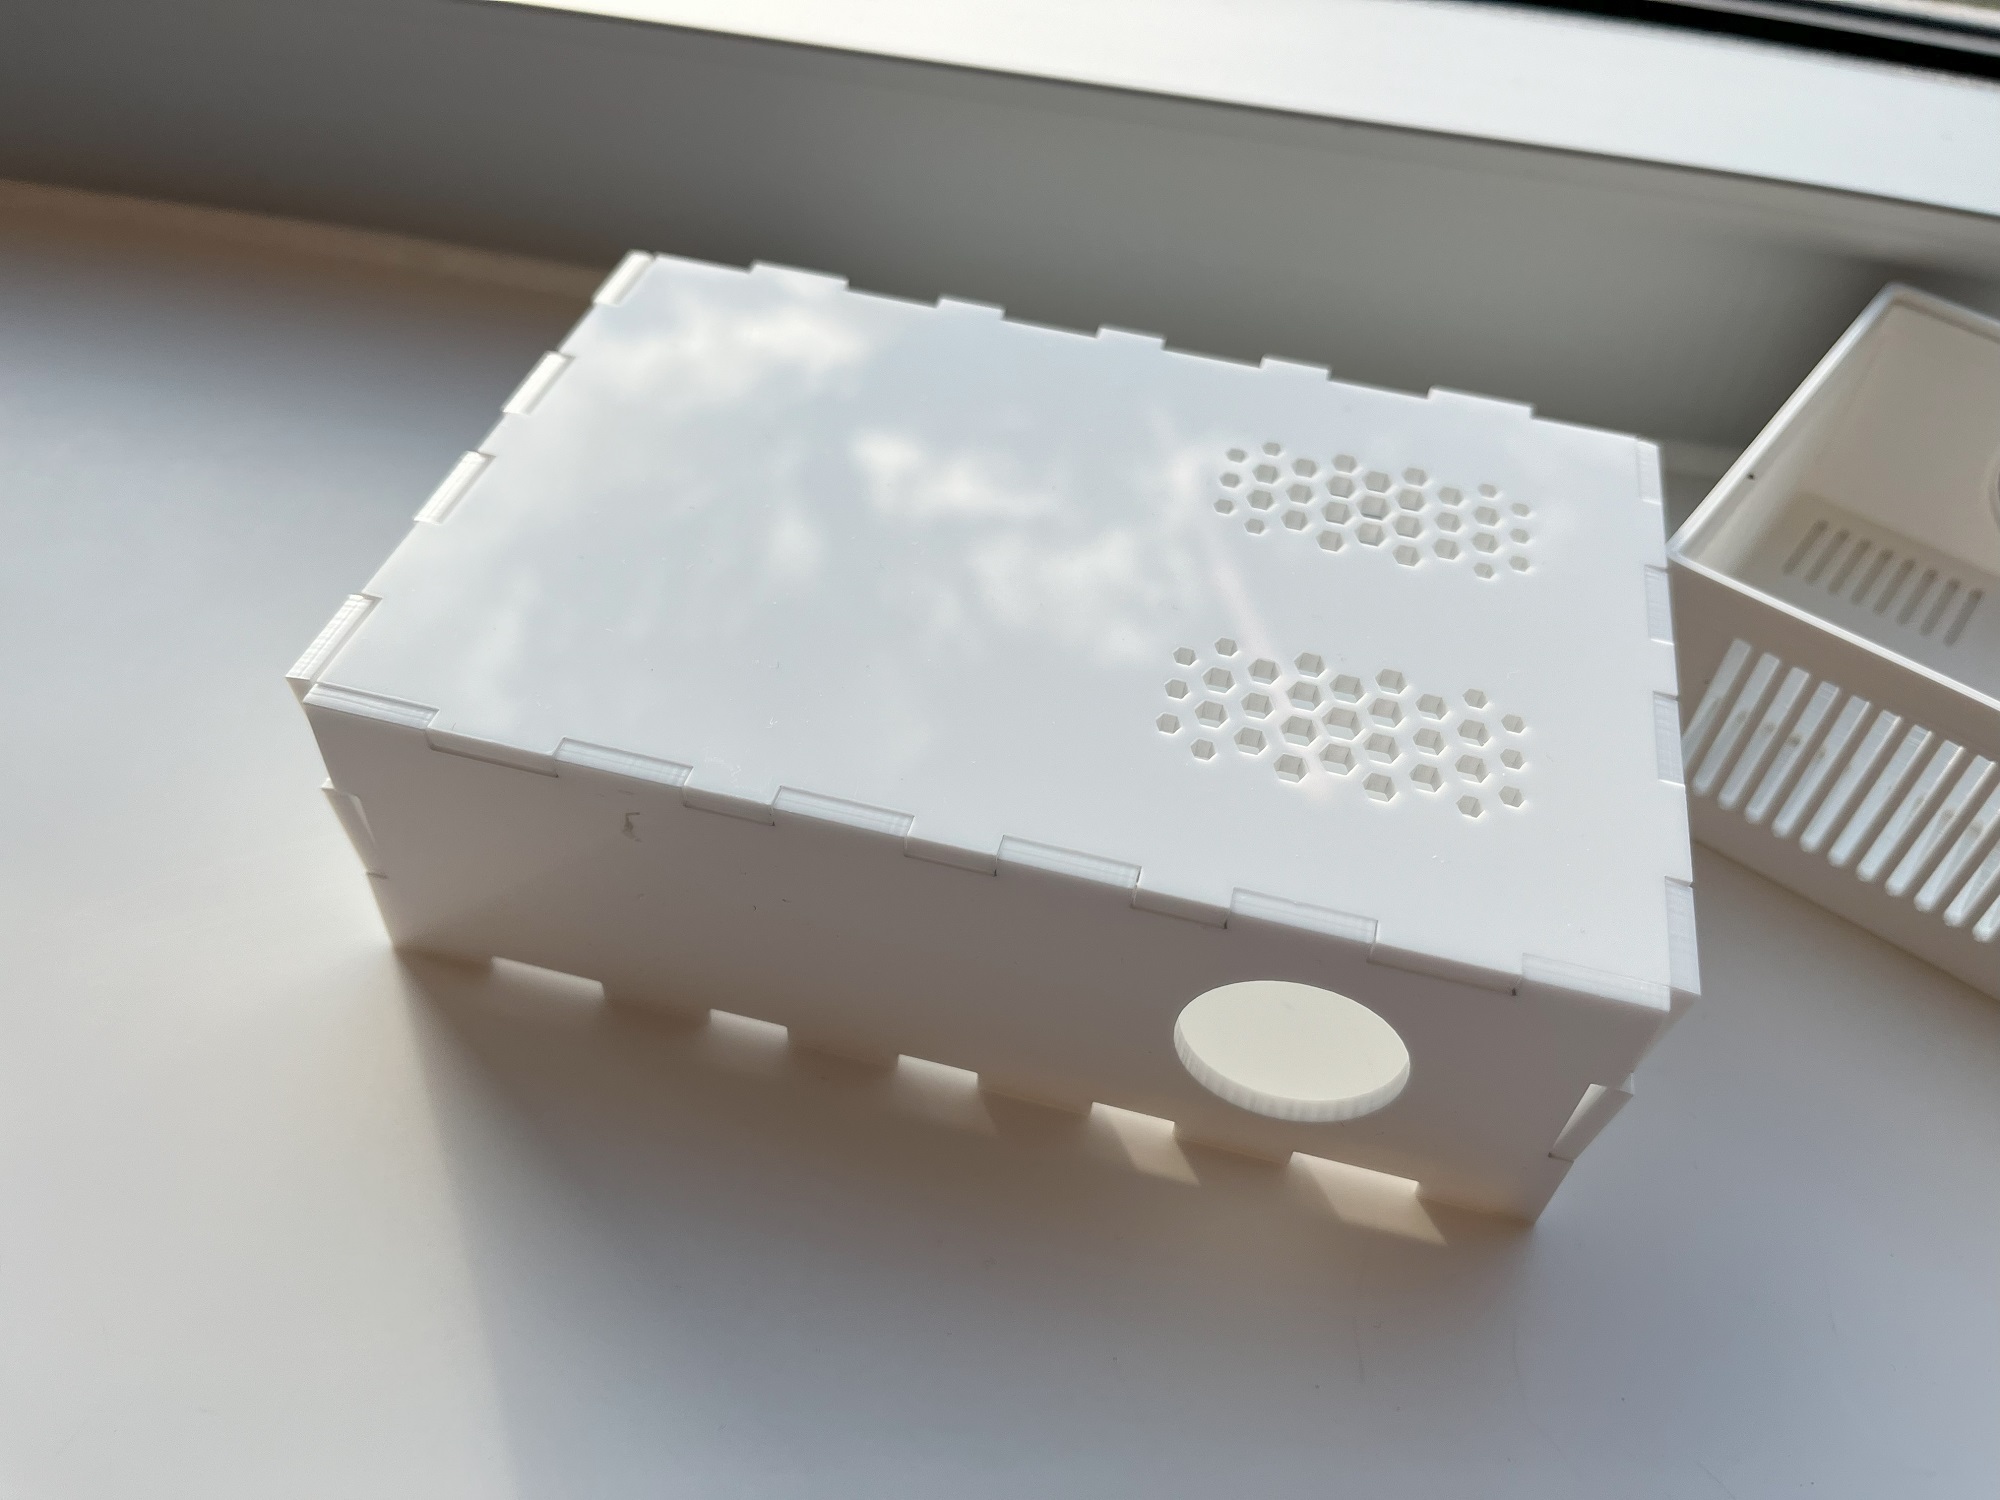
This allowed to position the sensors on both the walls and the base of the box, creating a more compact and efficient layout. This redesign reduced the size of the box by approximately 35%, making it more aesthetically pleasing and easier to deploy in the clinic.
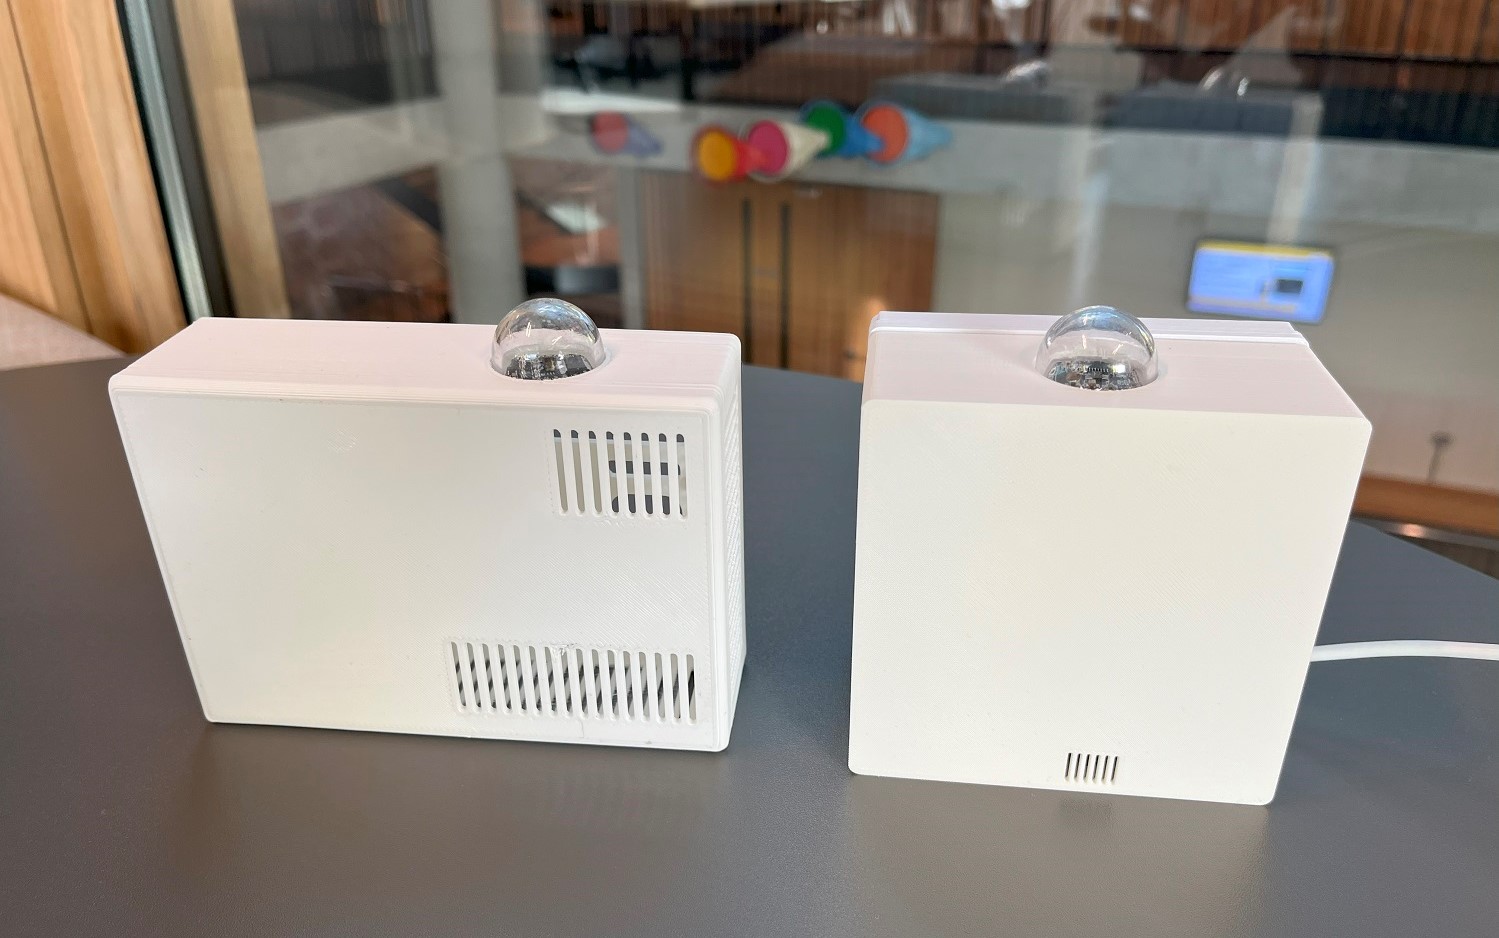
The first (left) and second (right) enclosures beside each other
Prototyping Process
Virtual prototyping
To ensure a practical design process, I reverse-engineered each sensor by taking detailed measurements and creating their 3D model twins in Fusion 360. This approach allowed me to try several layout arrangements virtually and quickly, which helped in having more accurate and efficient design iterations.
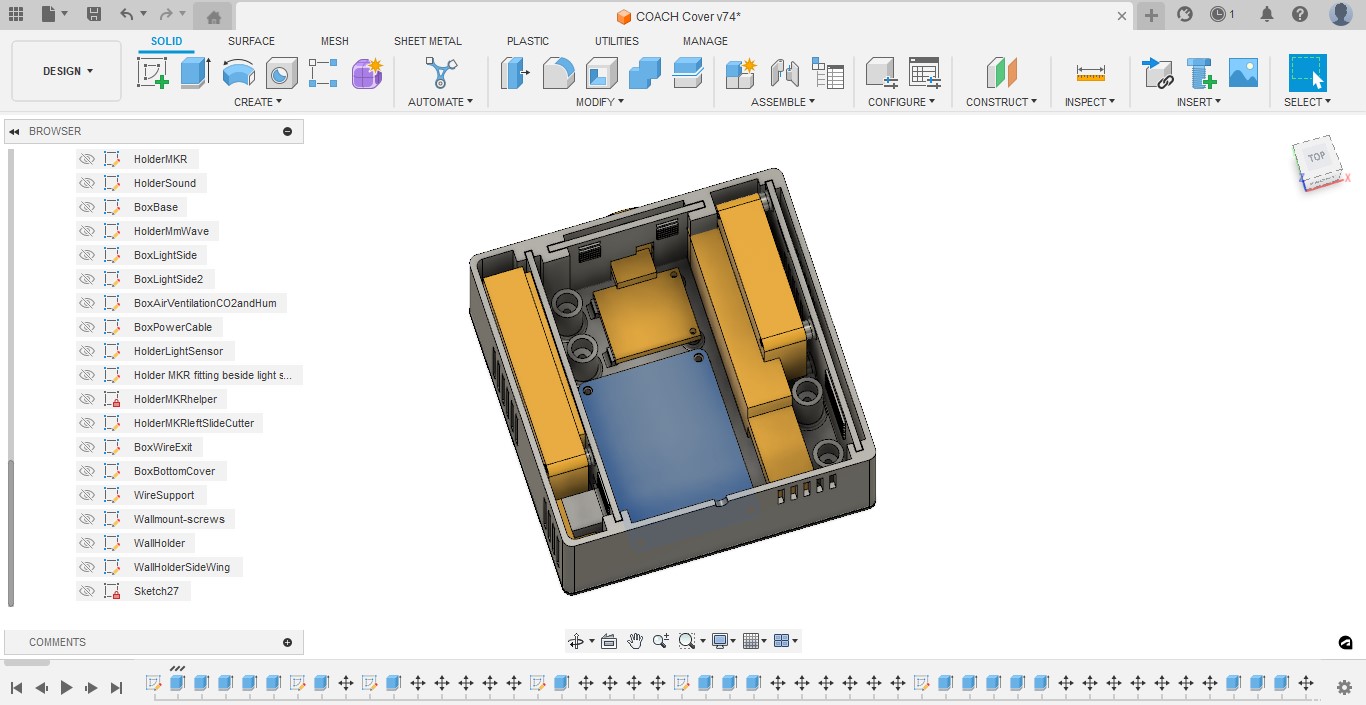
Enclosure prototyping using Fusion 360
Partial Prototyping
One of the key highlights during the prototyping process was the usage of partial prototyping concept. Instead of printing the entire enclosure each time a modification was needed, I printed only the relevant modular section. This approach significantly reduced the time and material costs associated with prototyping. Each COACH unit comprises of seven 3D-printed parts taking several hours to print, and by focusing on a individual component, I could print it in less than hour which allowed me to iterate quickly and effectively.
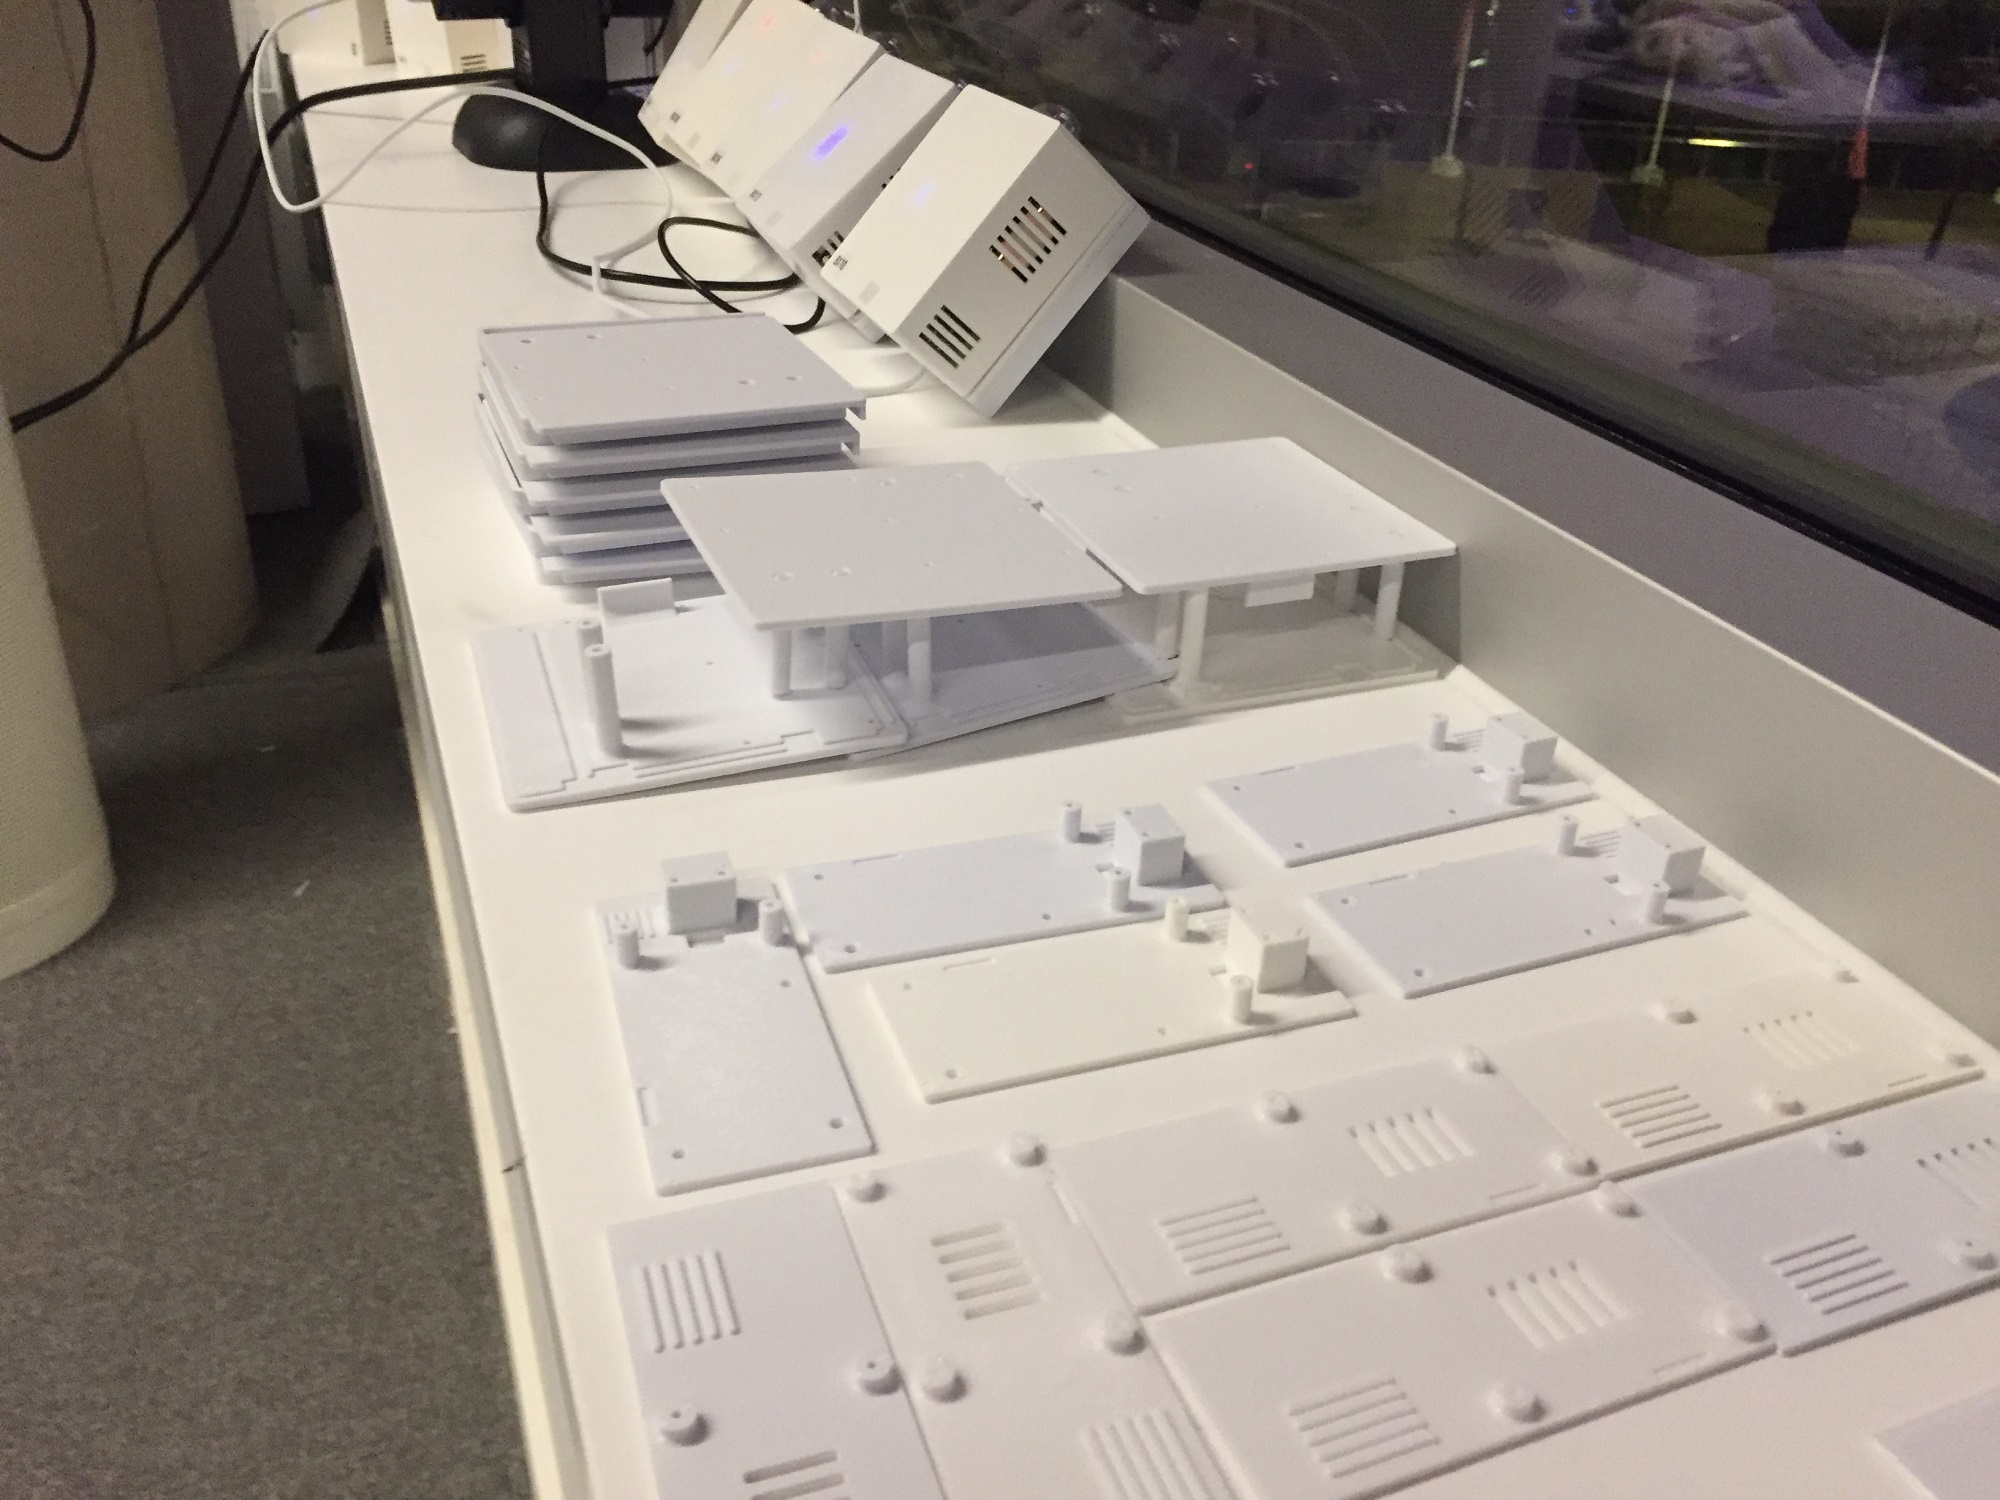
Different COACH parts, each of them had its own prototyping iterations
Slicing for Efficiency
In addition to partial prototyping, I also employed slicing techniques to print only the necessary portions of larger components. This method further expedited the prototyping process and ensured that each iteration was as efficient as possible.
I iterated only on the portion of the box that I was working on, which was sliced to reduce printing time. Printing the whole box takes up to 5 hours, the sliced part takes less than 40 minutes.
Deployment Challenges and Solutions
Deployment Mechanism
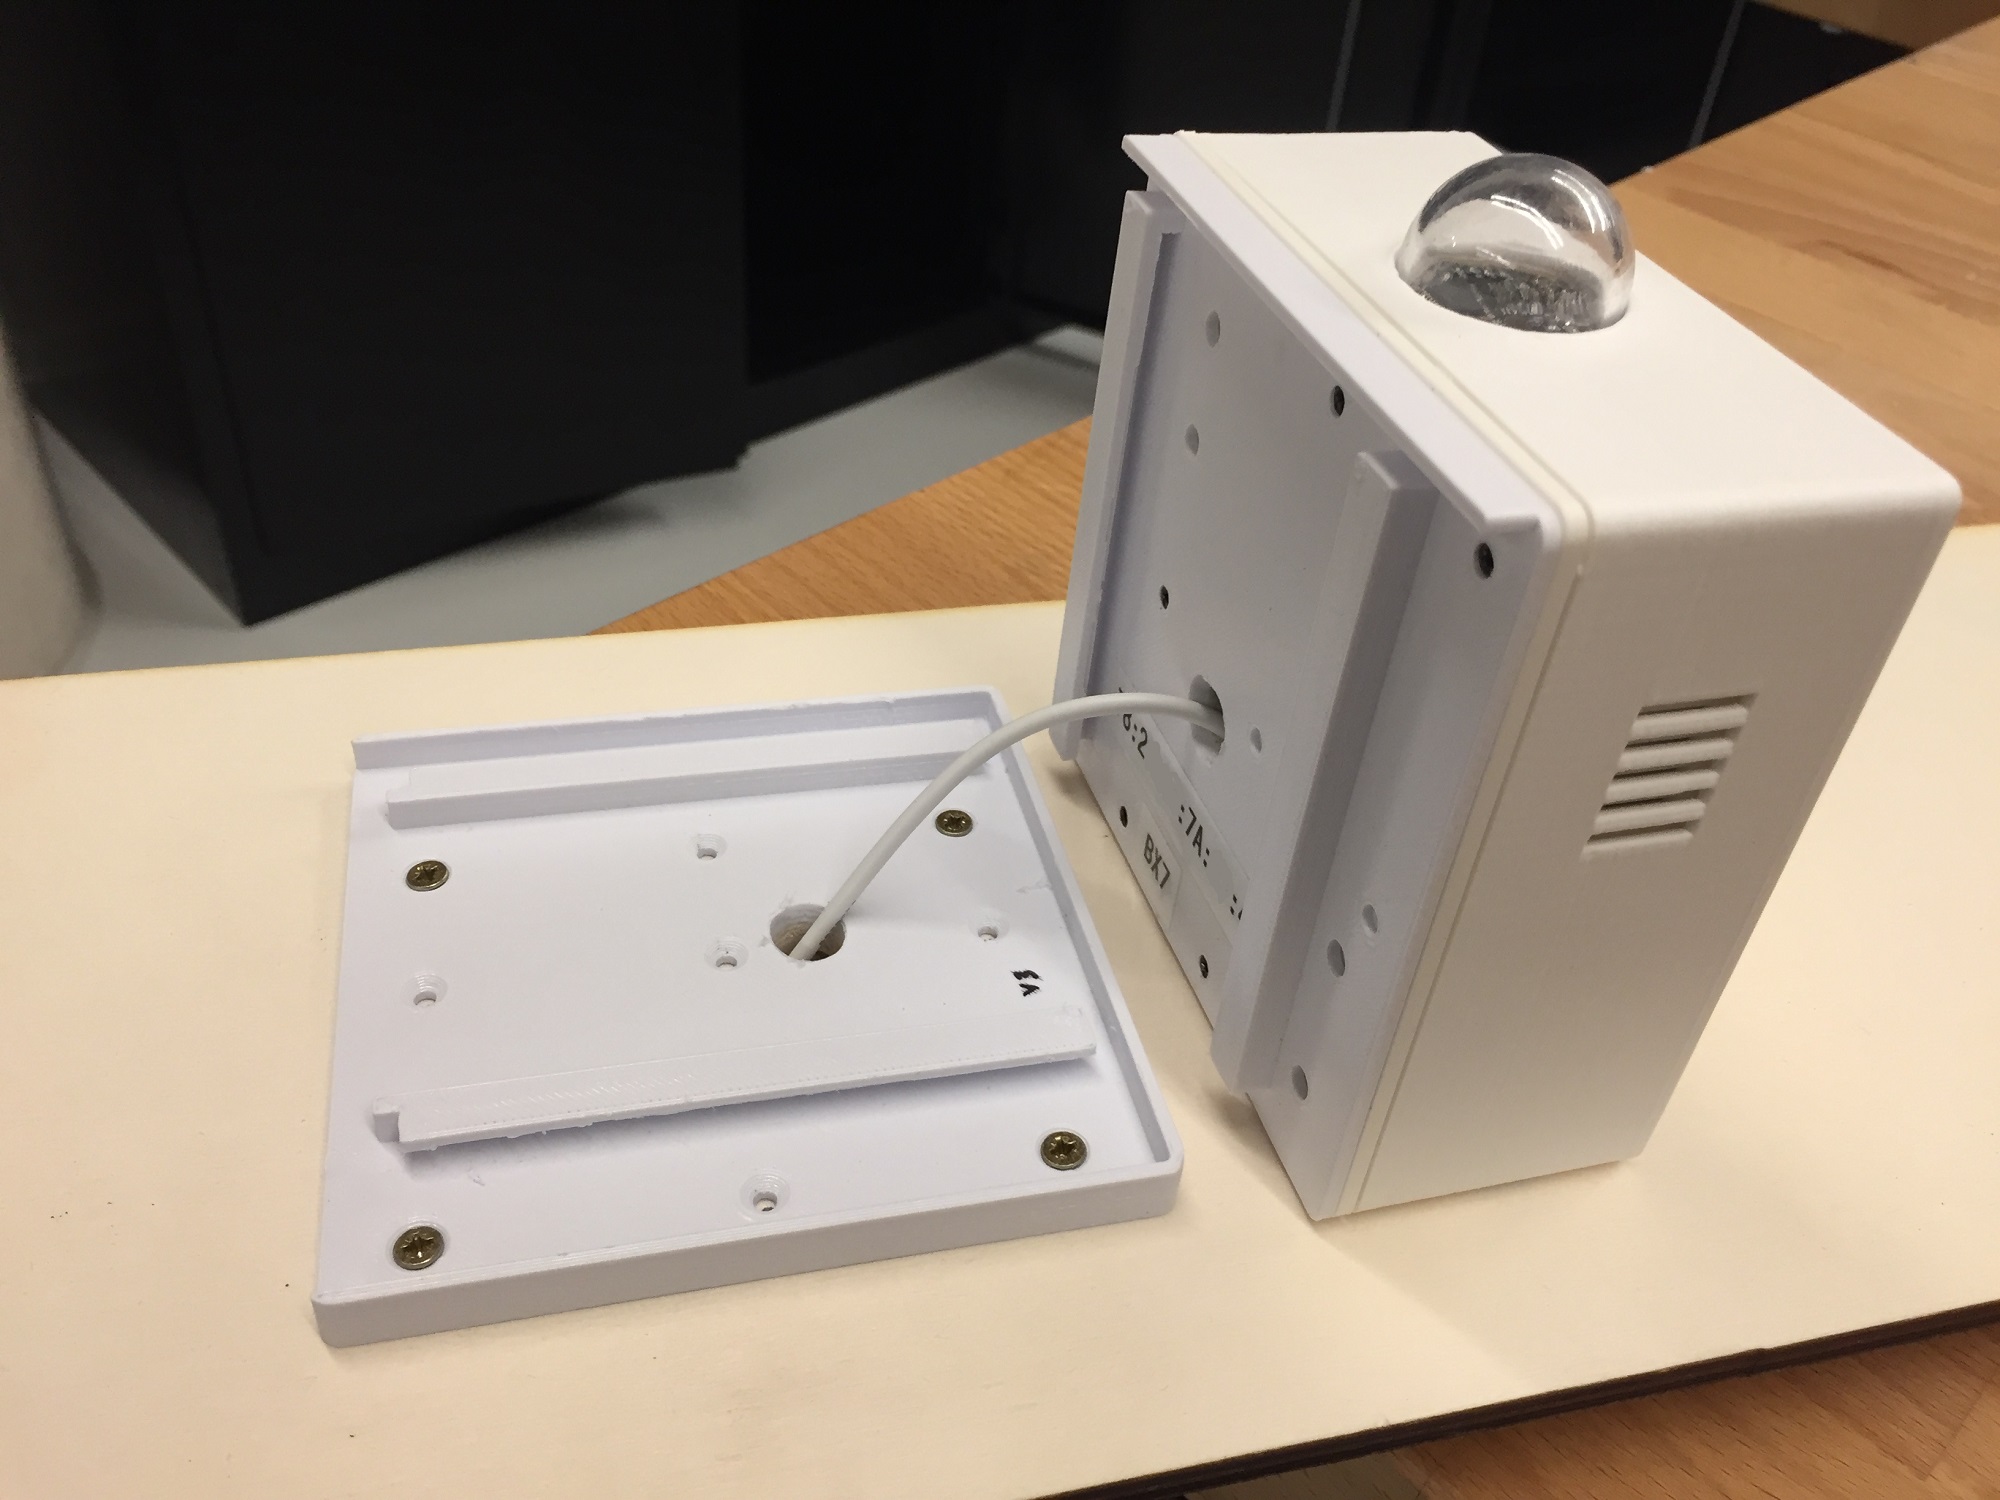
One of the significant challenges was designing a flexible and non-invasive deployment mechanism. Based on my research into existing devices, I adopted a base-and-track system. This design allows the COACH units to be easily mounted and removed without damaging walls or ceilings. The units slide into a fixed base, making installation and maintenance straightforward.
This image shows the sliding mechanism of the COACH device.
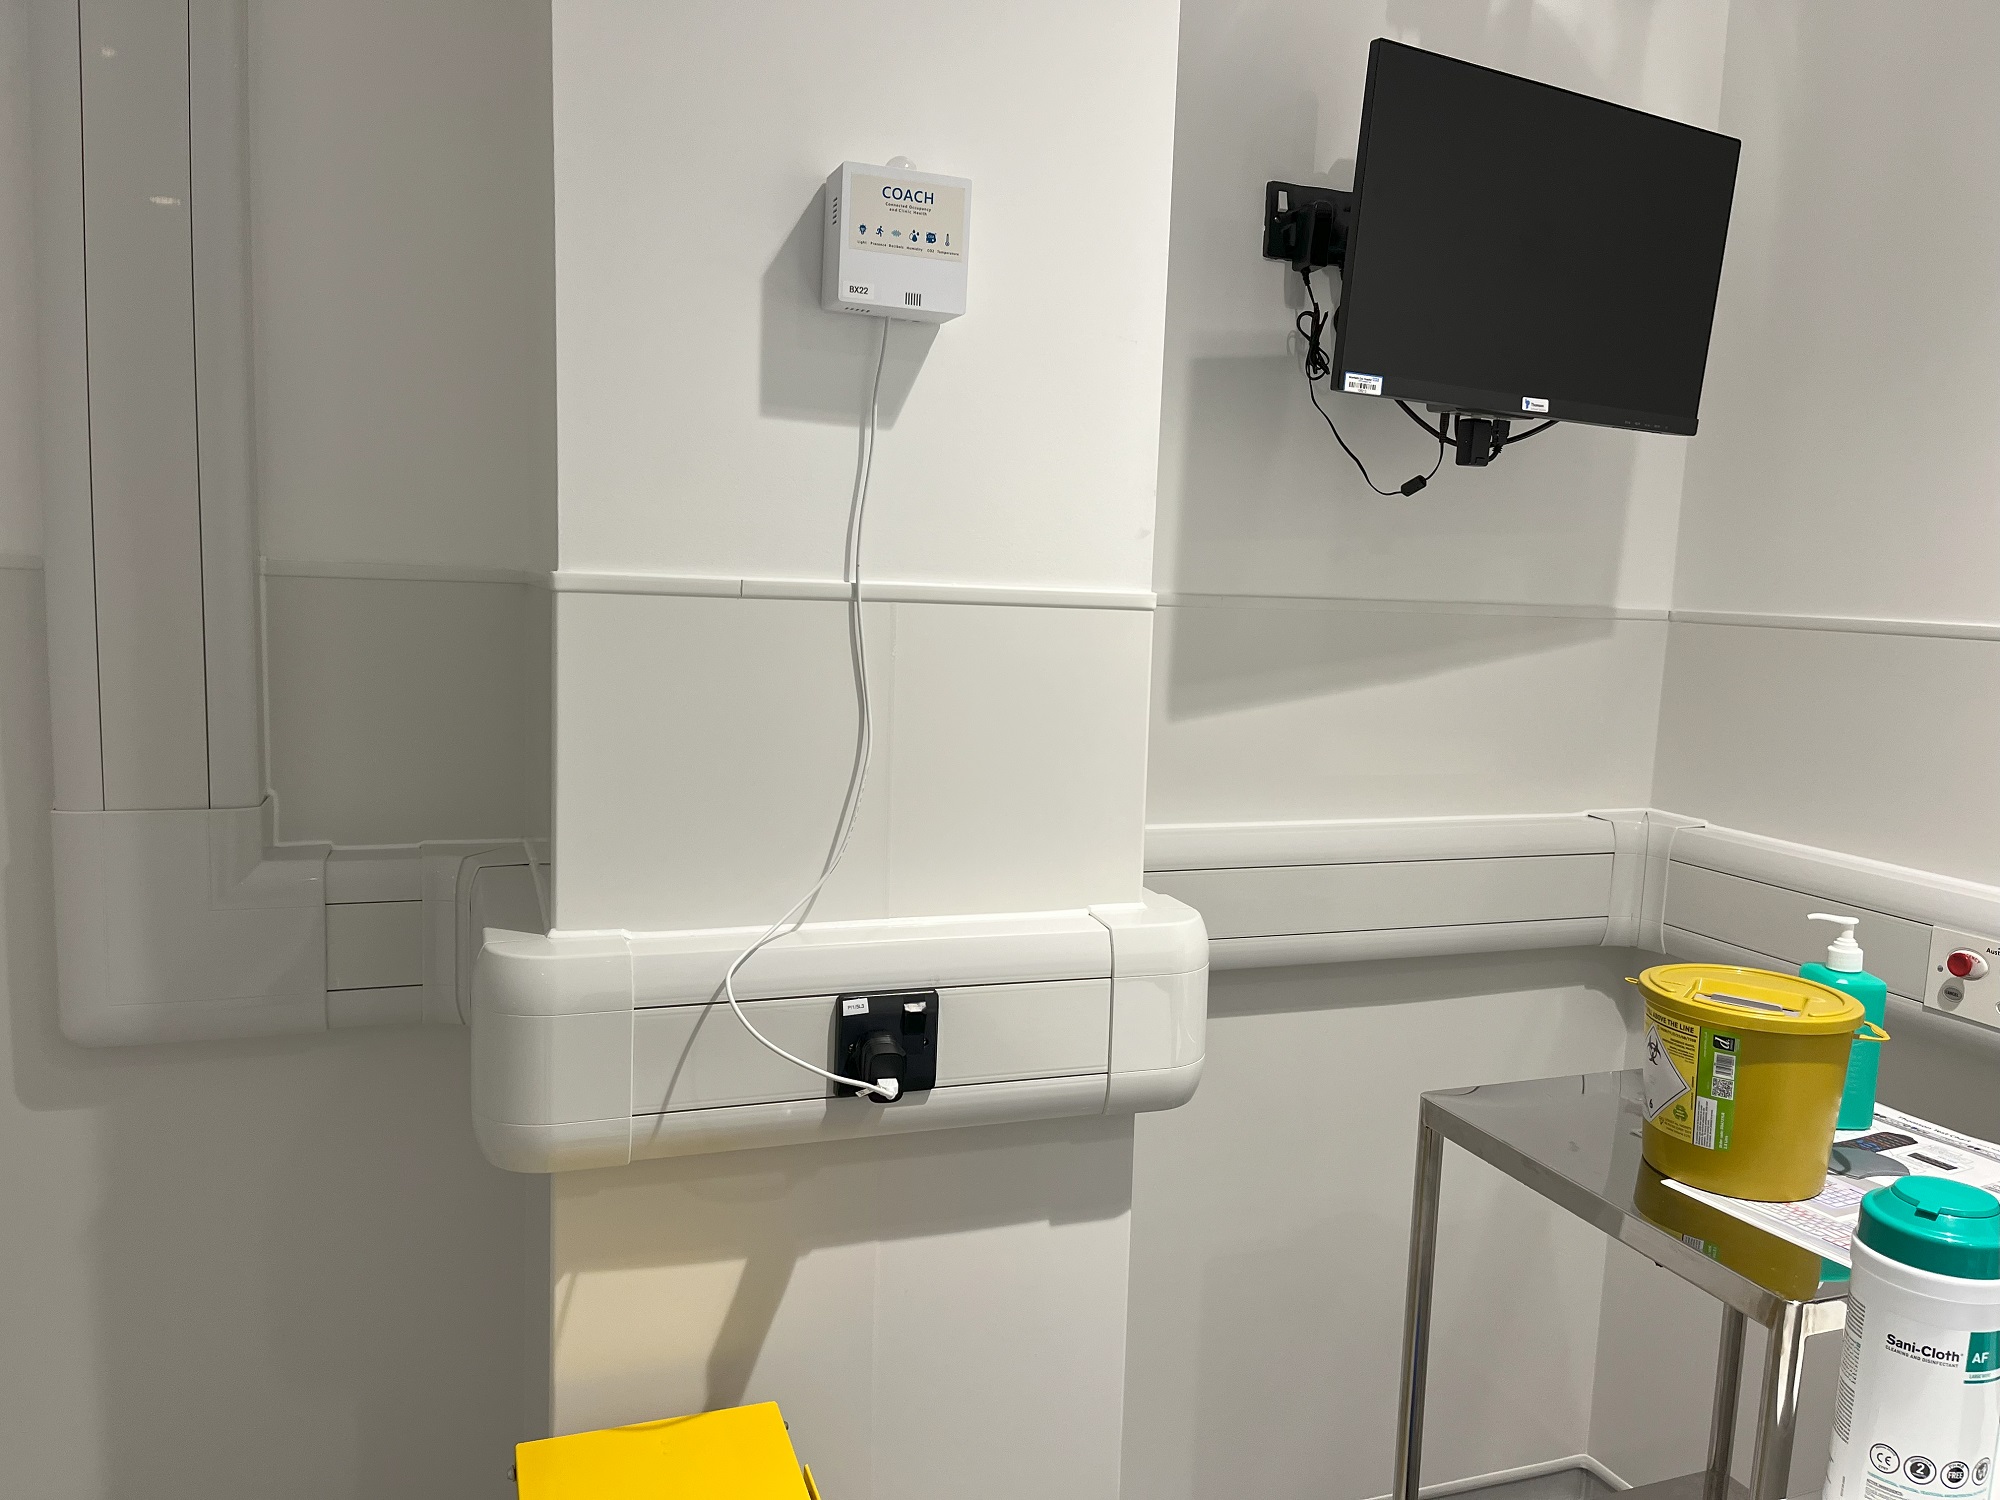
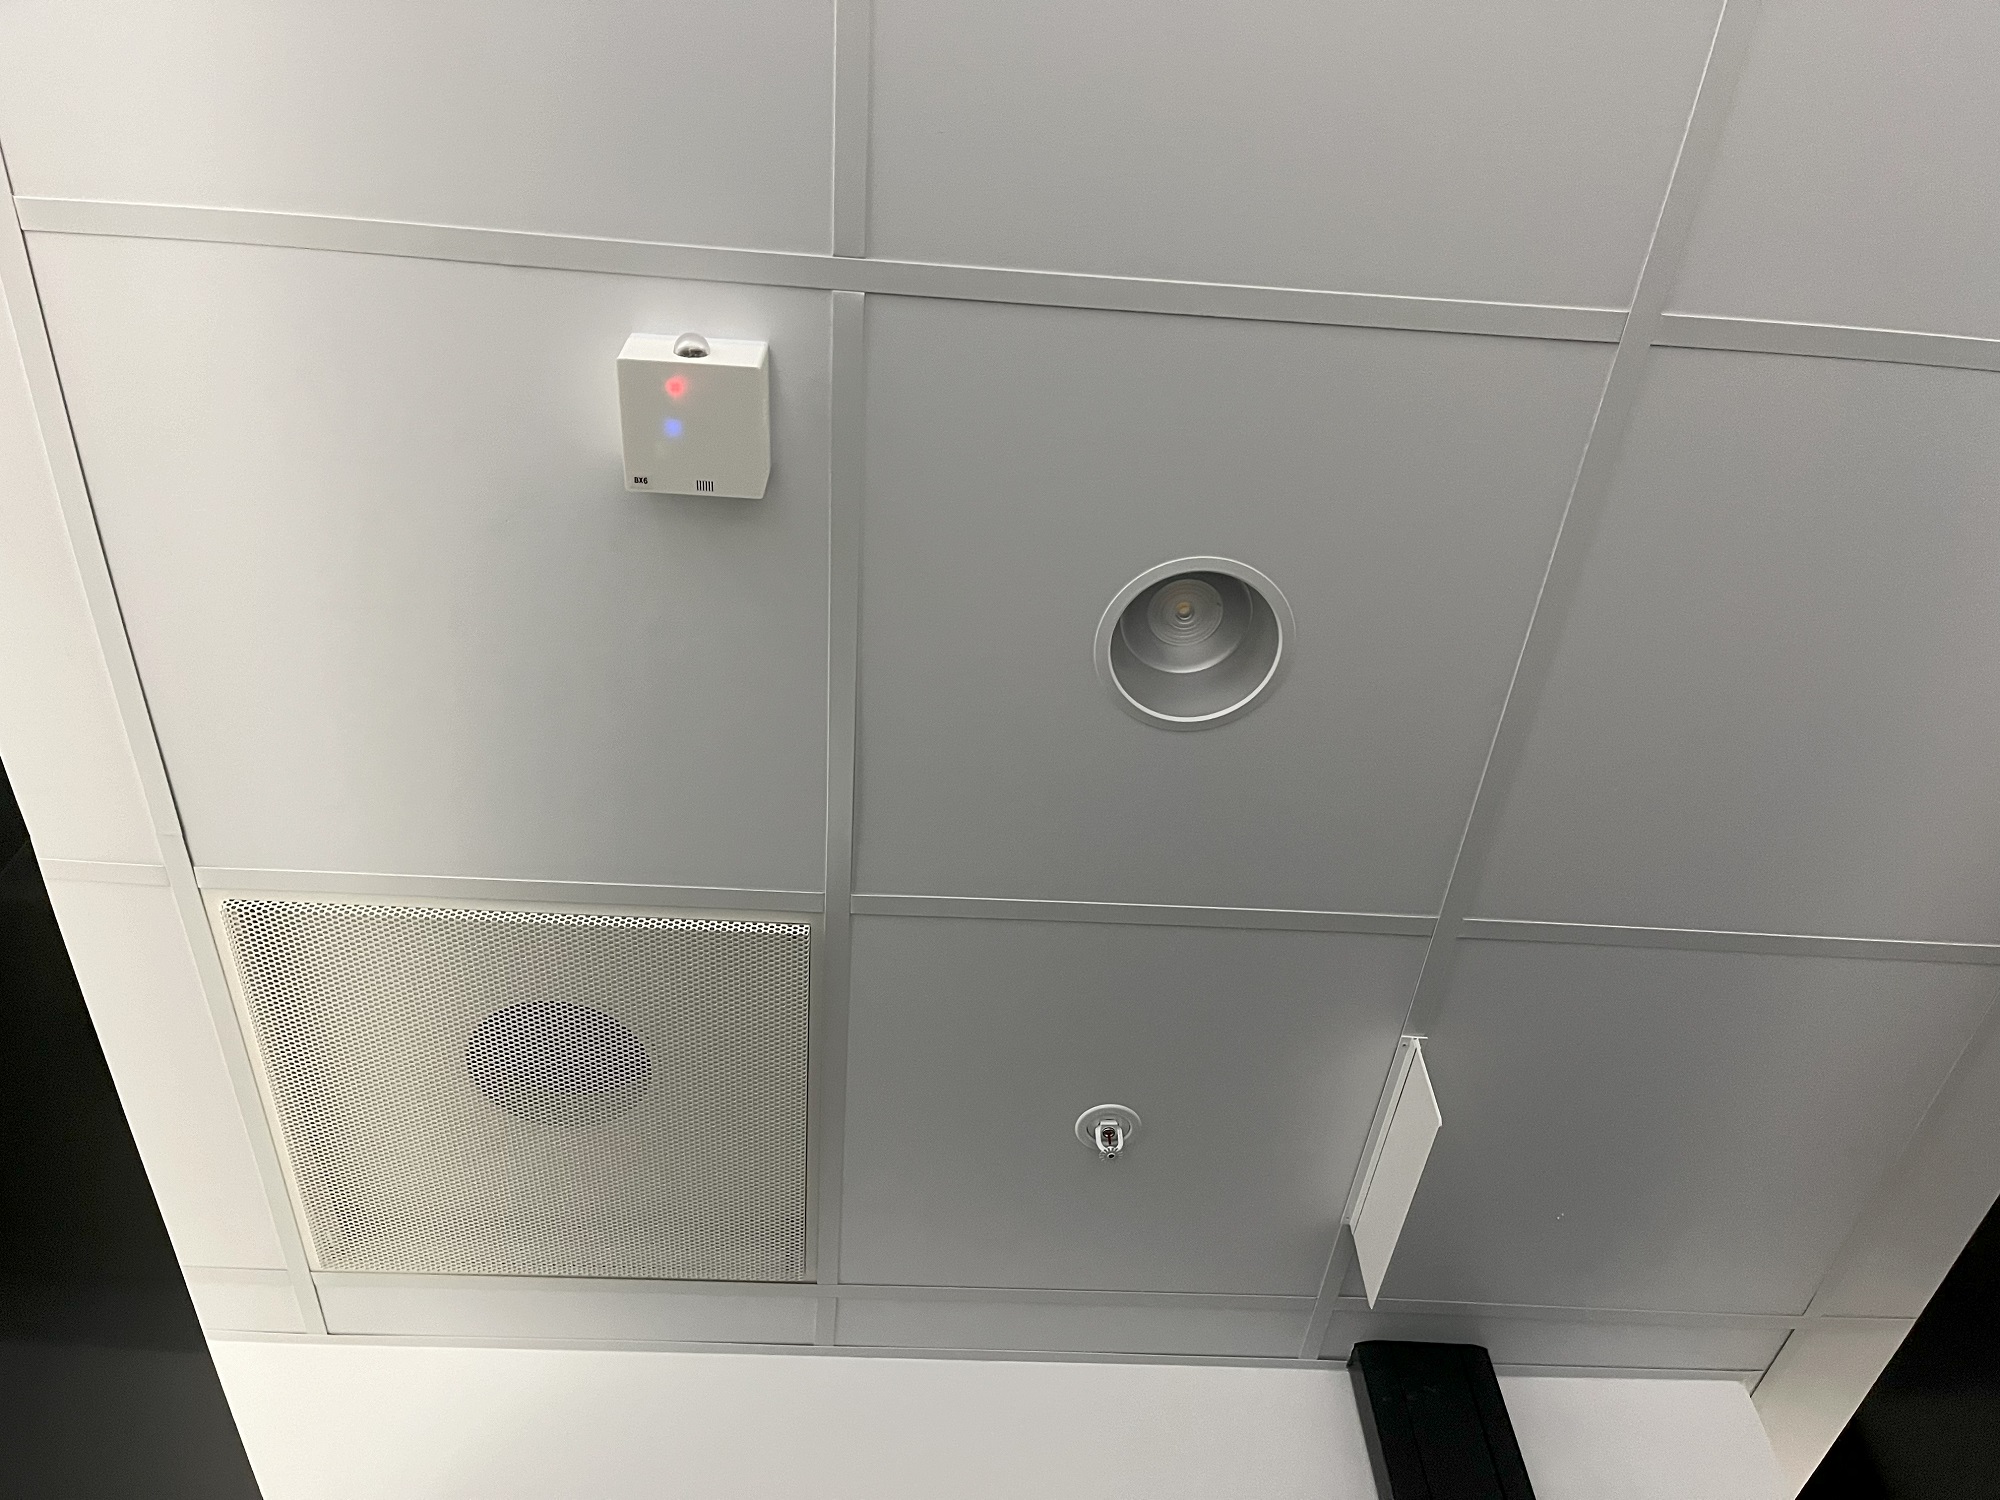
Adaptability to Different Mounting Locations
Initially designed for wall mounting, the COACH units needed to be adapted for ceiling mounting in some cases. Thanks to the base-and-track design, this modification was relatively simple and quick to implement without reprinting the enclosures.
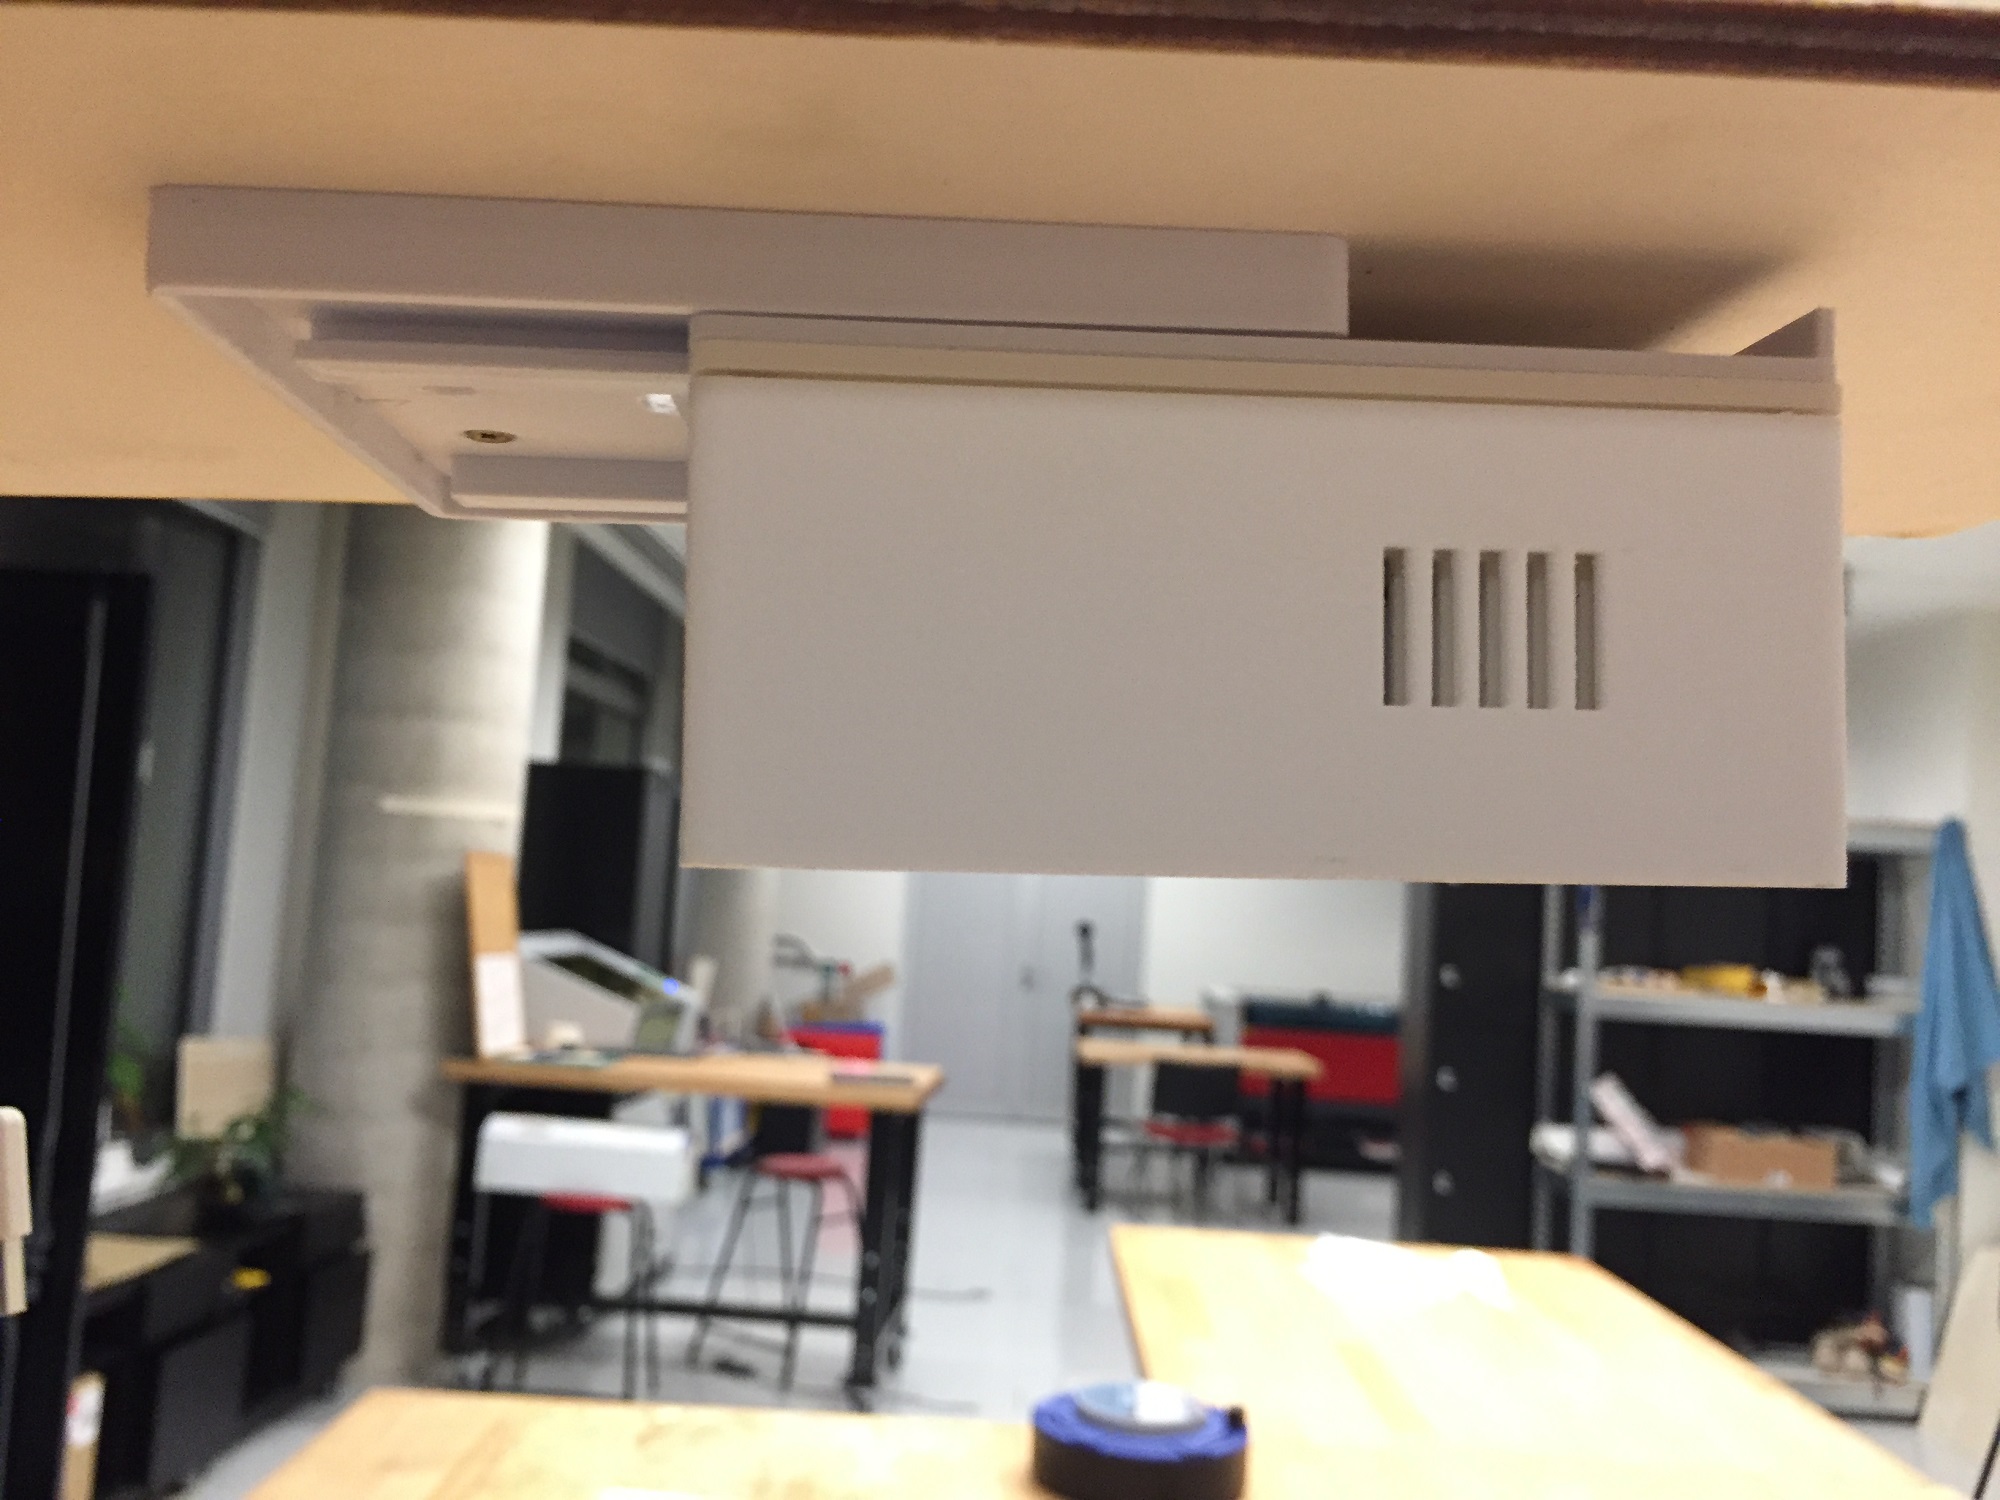
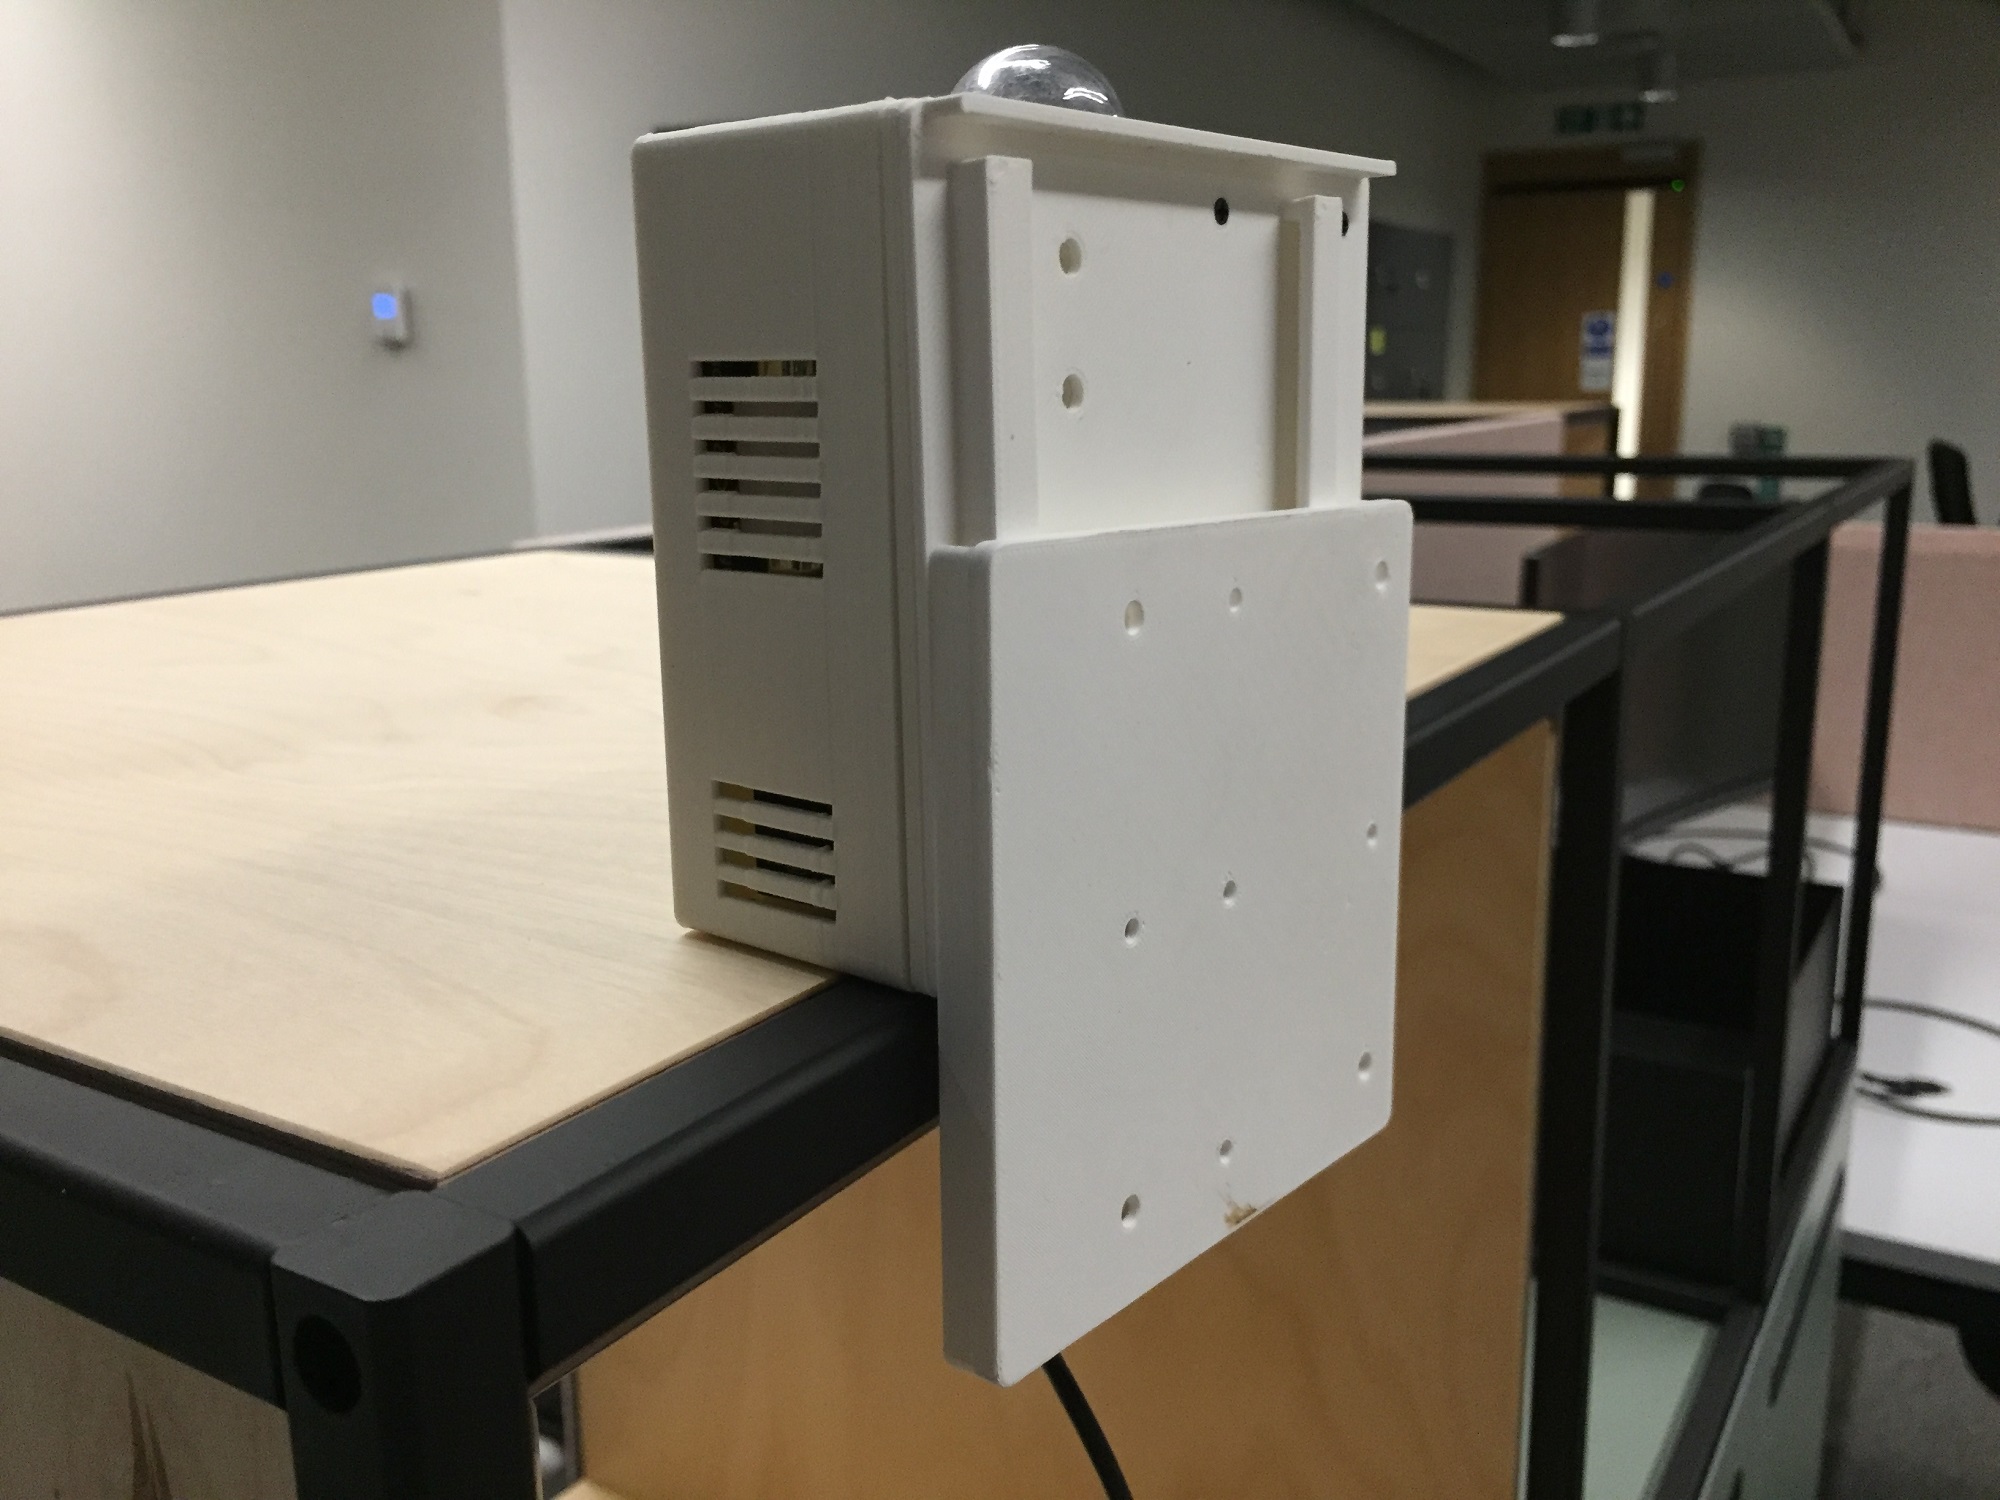
Mounting the COACH device on a ceiling tile
Manufacturing and assembling
Manufacturing Pipeline
To manufacture 20 COACH units, I established a simple but effective production pipeline. Each unit, composed of 7 3D-printed parts, 5 sensors, several wires and screws, and 1 microcontroller required careful tracking to ensure quality and consistency. I created a custom spreadsheet to monitor the production process, track print and sensor failures, and ensure that all parts met the required standards.
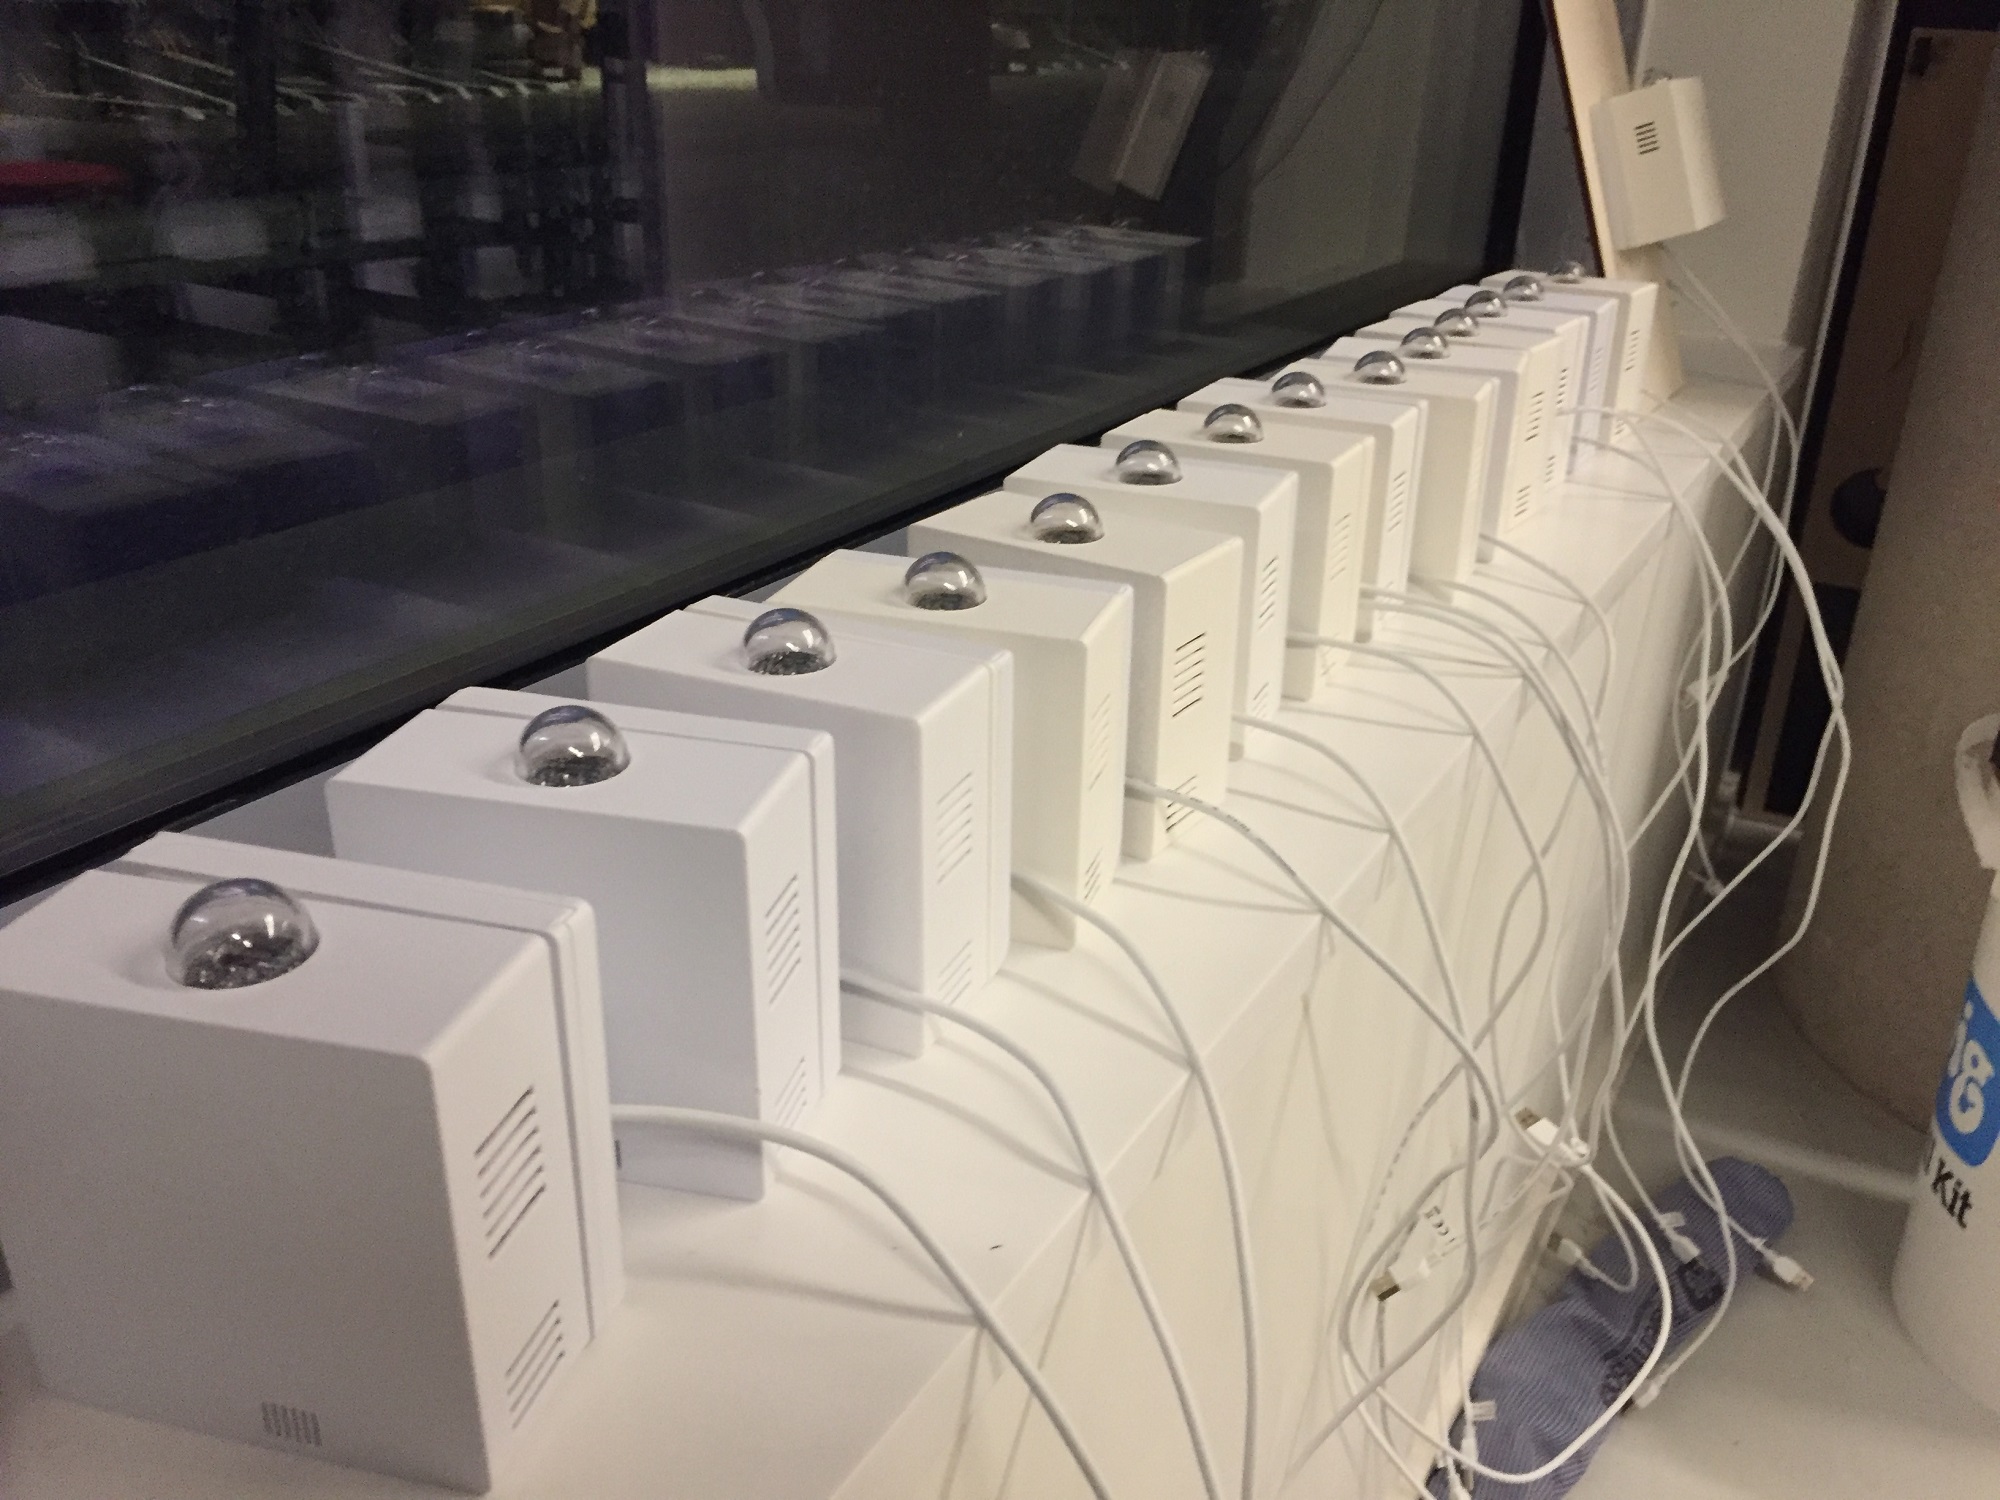
COACH devices lined up to be tested after assembly
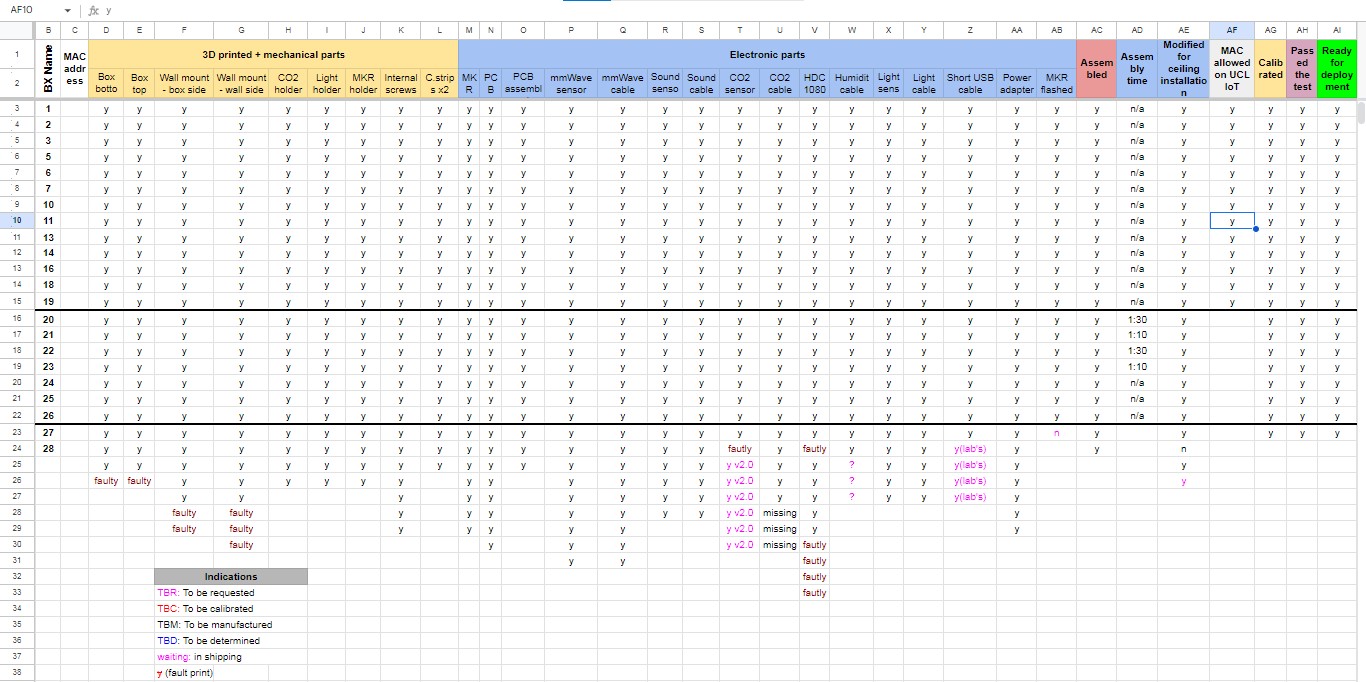
COACH production sheet (click to see in full size)
Assembly and Testing
After manufacturing and assembling the COACH units, I deployed them in our lab for testing. This phase revealed several critical issues, including power instability and sensor interference.
Key Challenges and Solutions
Power Stability Issues
One of the first challenges encountered was the COACH units frequently restarting due to power issues. Thanks to Martin De Jode, we discovered that long USB cables caused significant voltage drops which caused the microcontroller (MKR Wifi 1010) to reboot. Replacing these with shorter cables mitigated the problem, but it highlighted the high power consumption of the units due to the numerous sensors.
Noisy Power Supplies
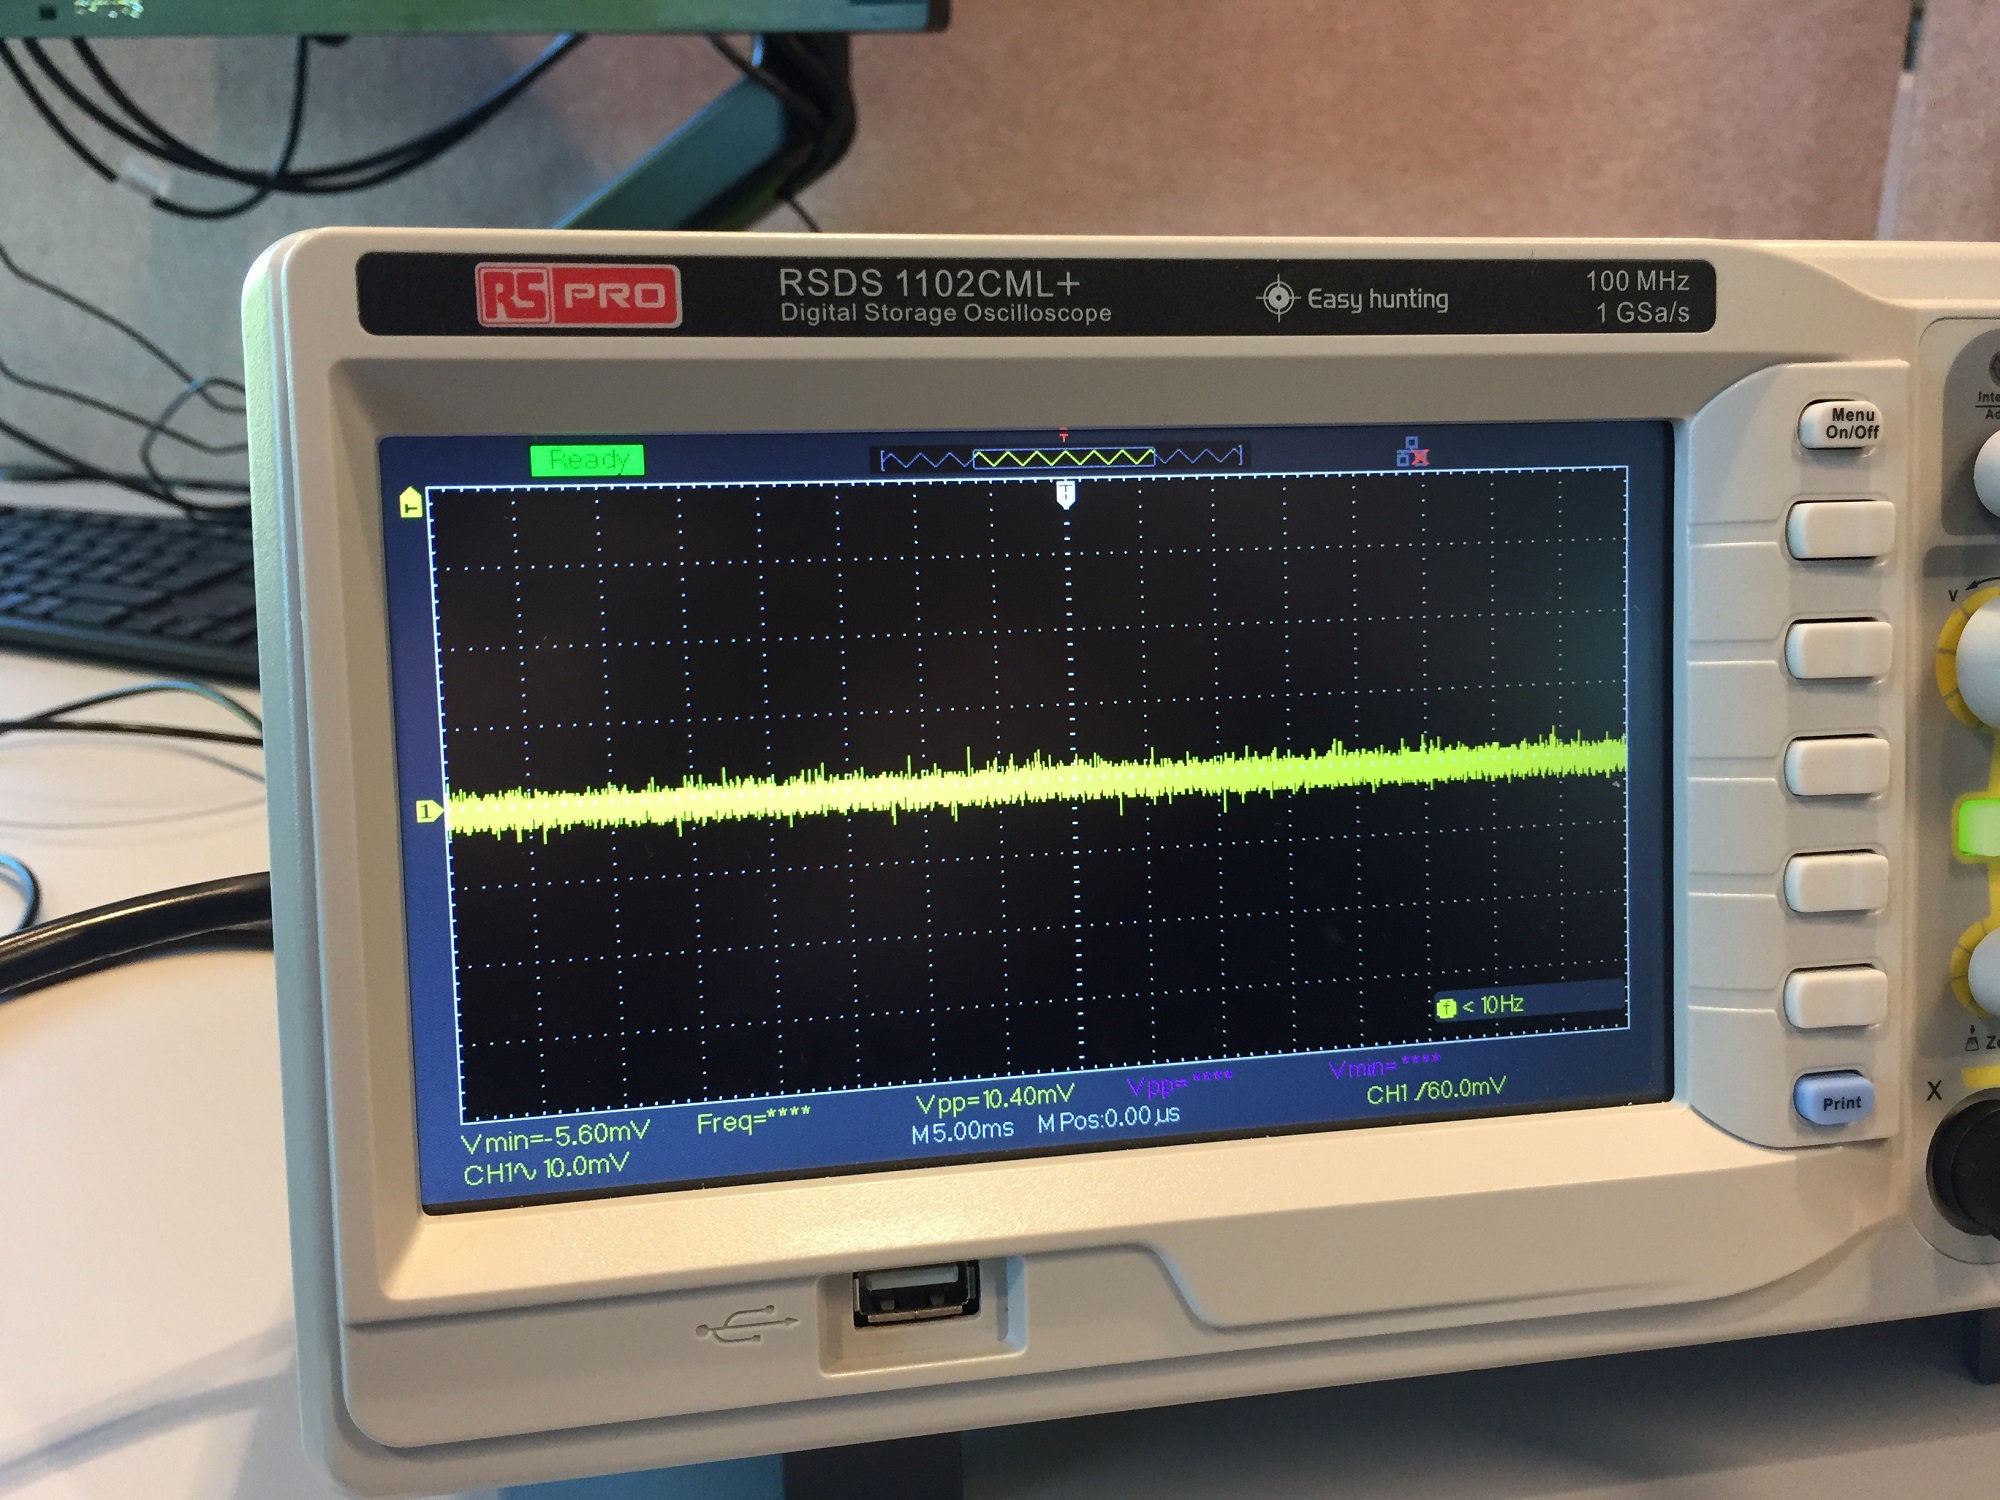
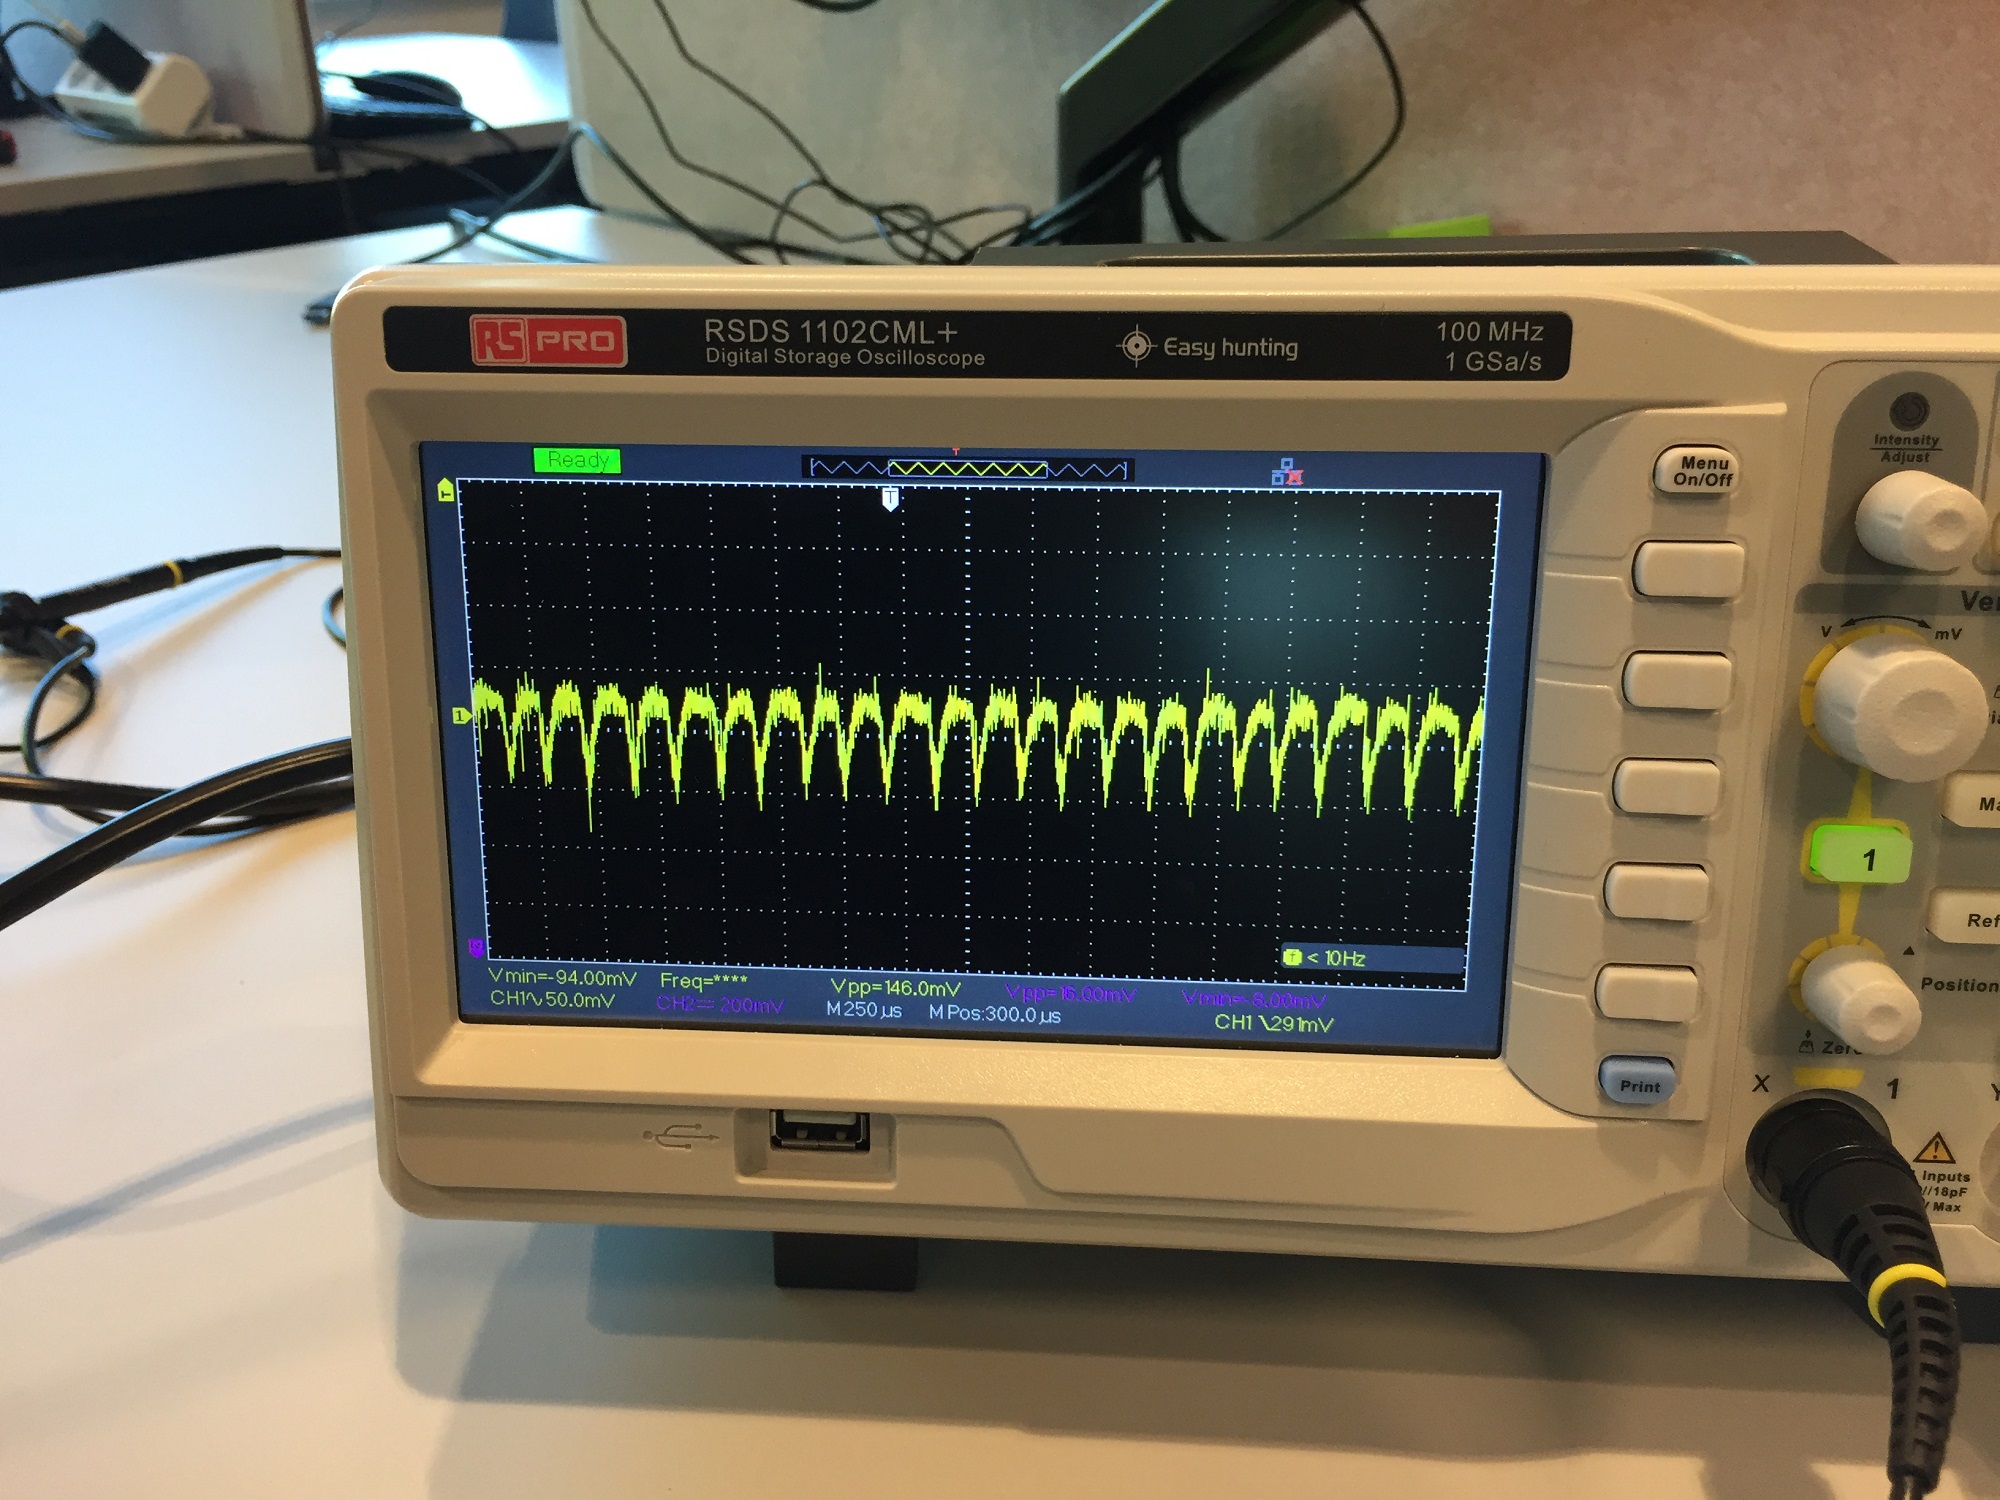
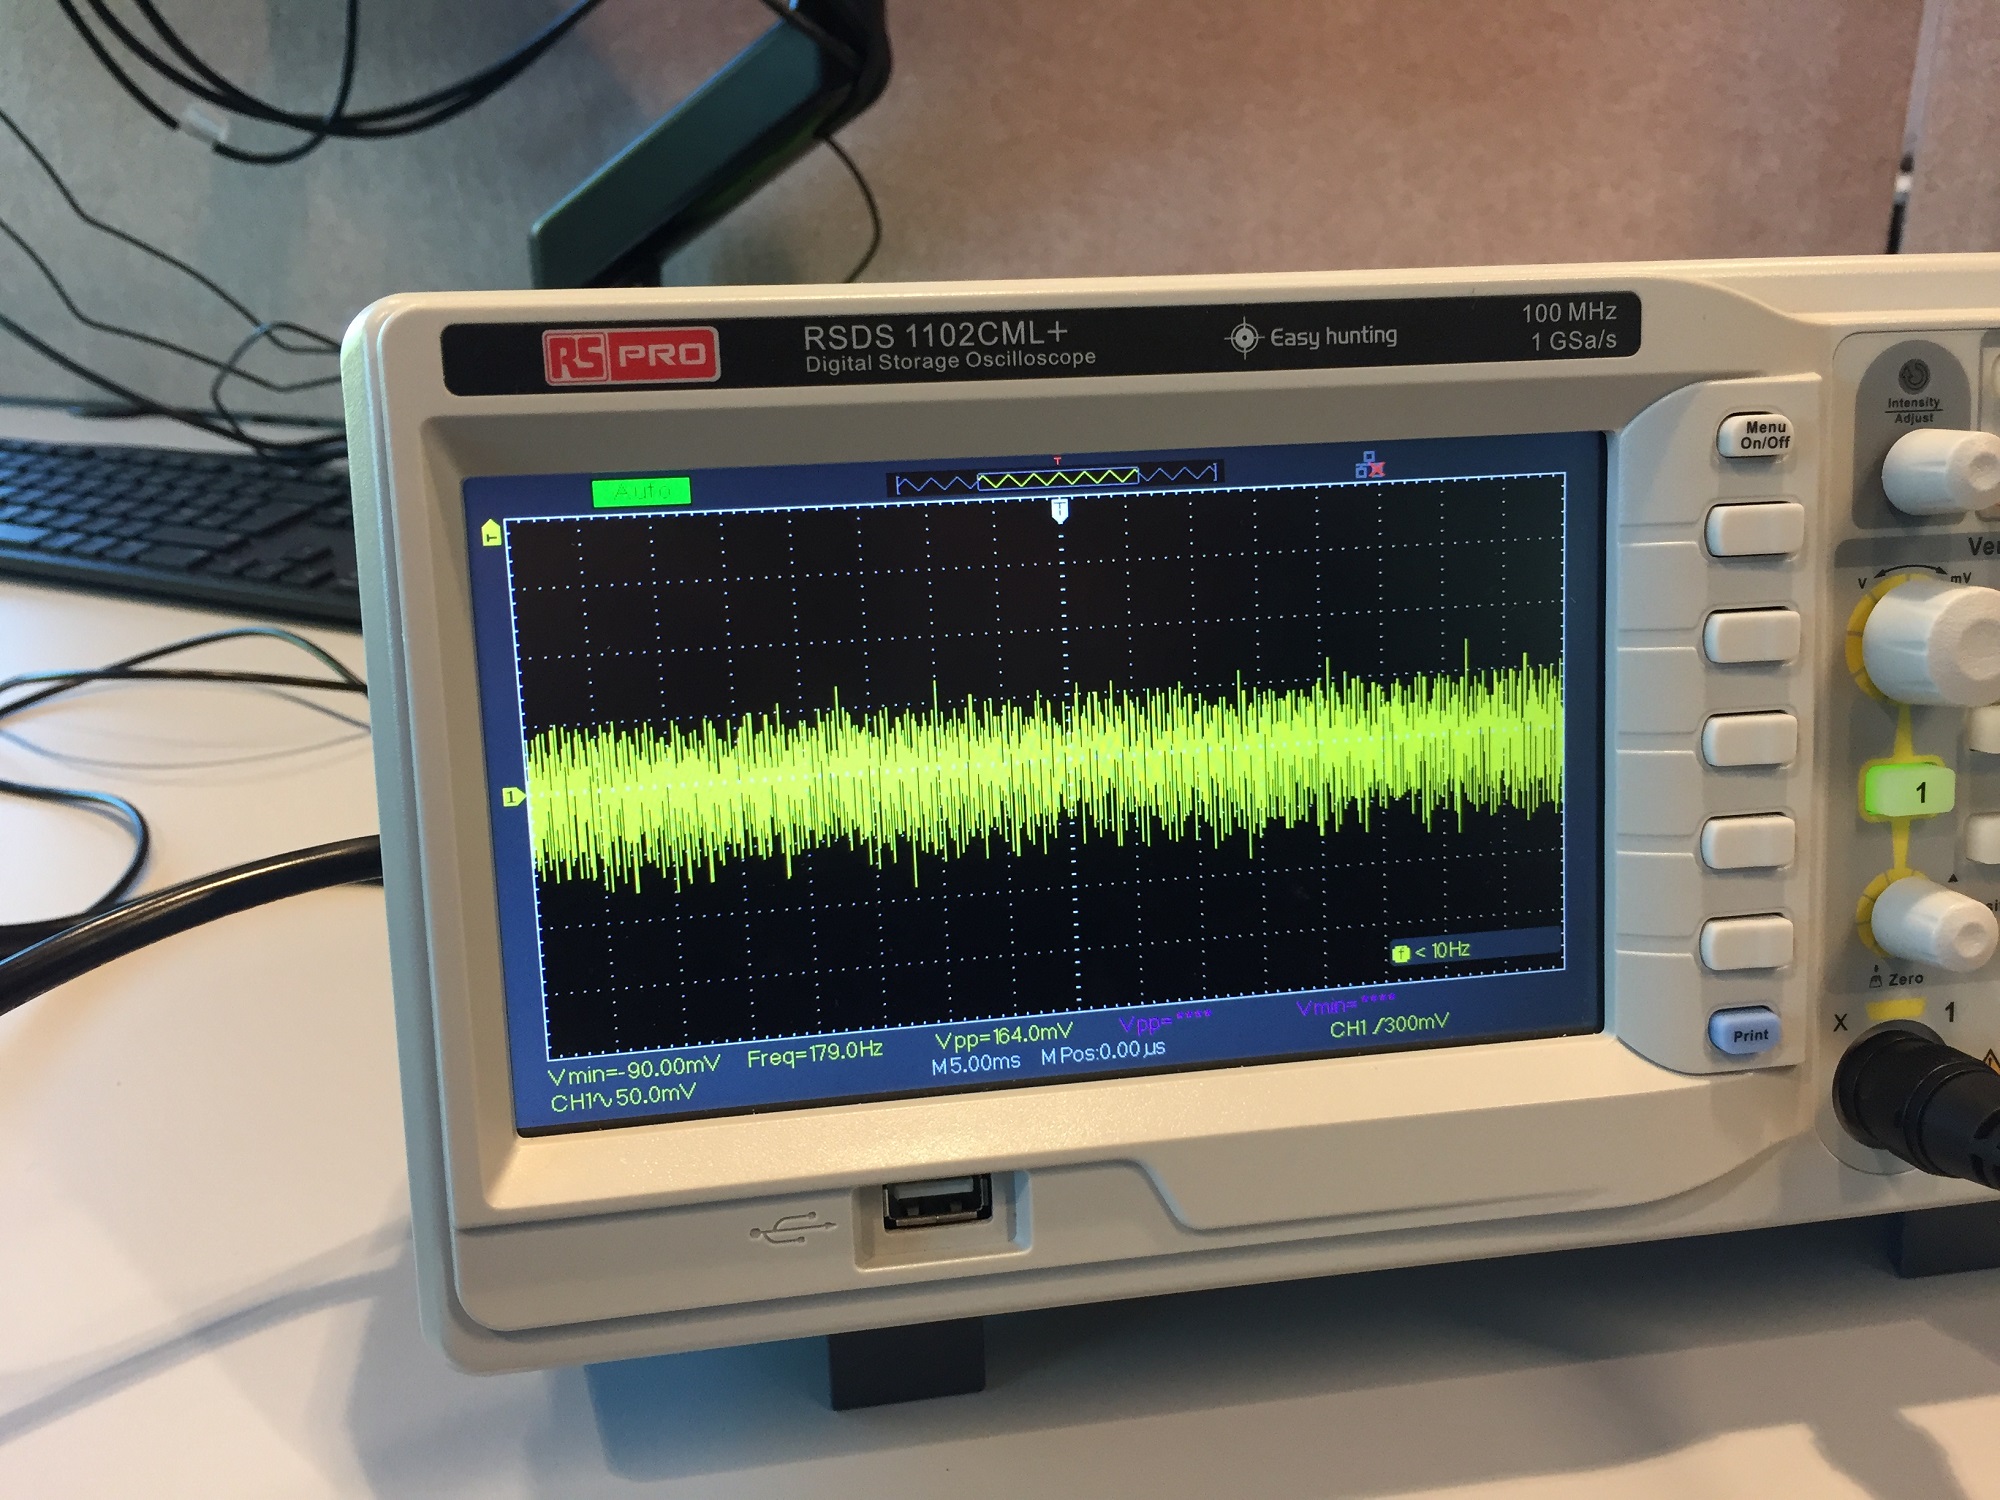
Another significant issue was the quality of the power adapters. Initially, high-quality power sources were used in lab experiments, but when switched to deployable adapters (which have less quality), the COACH units began to experience power instability. Oscilloscope analysis revealed that these adapters had up to 200 millivolt peak-to-peak (Vp-p) fluctuations compared to 10 Vpp of the lab power supply. To address this, we sourced adapters with Vpp levels between 60 and 80, reducing but not entirely eliminating the problem.


Starting from the first image on the left: lab’s power supply which has top quality (Vpp is 10 mV). Second image: mid-quality power adapter (Vpp is 146 mV). Third image: low-quality power adapter (Vpp is 164 mV)
Sensor Interference
The millimetre wave radar, operating at 24 GHz, experienced interference issues, particularly from noisy power supplies. Wires on unused pins on the radar acted as antennas picking up rogue signals and disrupting the sensor’s functionality when the Vpp is 164 mV, although it worked normally when the Vpp was 10 mV. The solution involved removing unused wires on unused pins and ensuring the power supply quality was as high as possible.
3D Printer Variability
During the manufacturing process, I encountered differences in the tolerances of the 3D printers used. While most parts could be printed on Ultimaker printers in the fabrication workshop at UCL One Pool Street, the sliding mechanisms for the deployment tracks only worked correctly when printed on Prusa printers due to nozzle tolerance differences. This discrepancy required reprinting several components to ensure proper functionality.
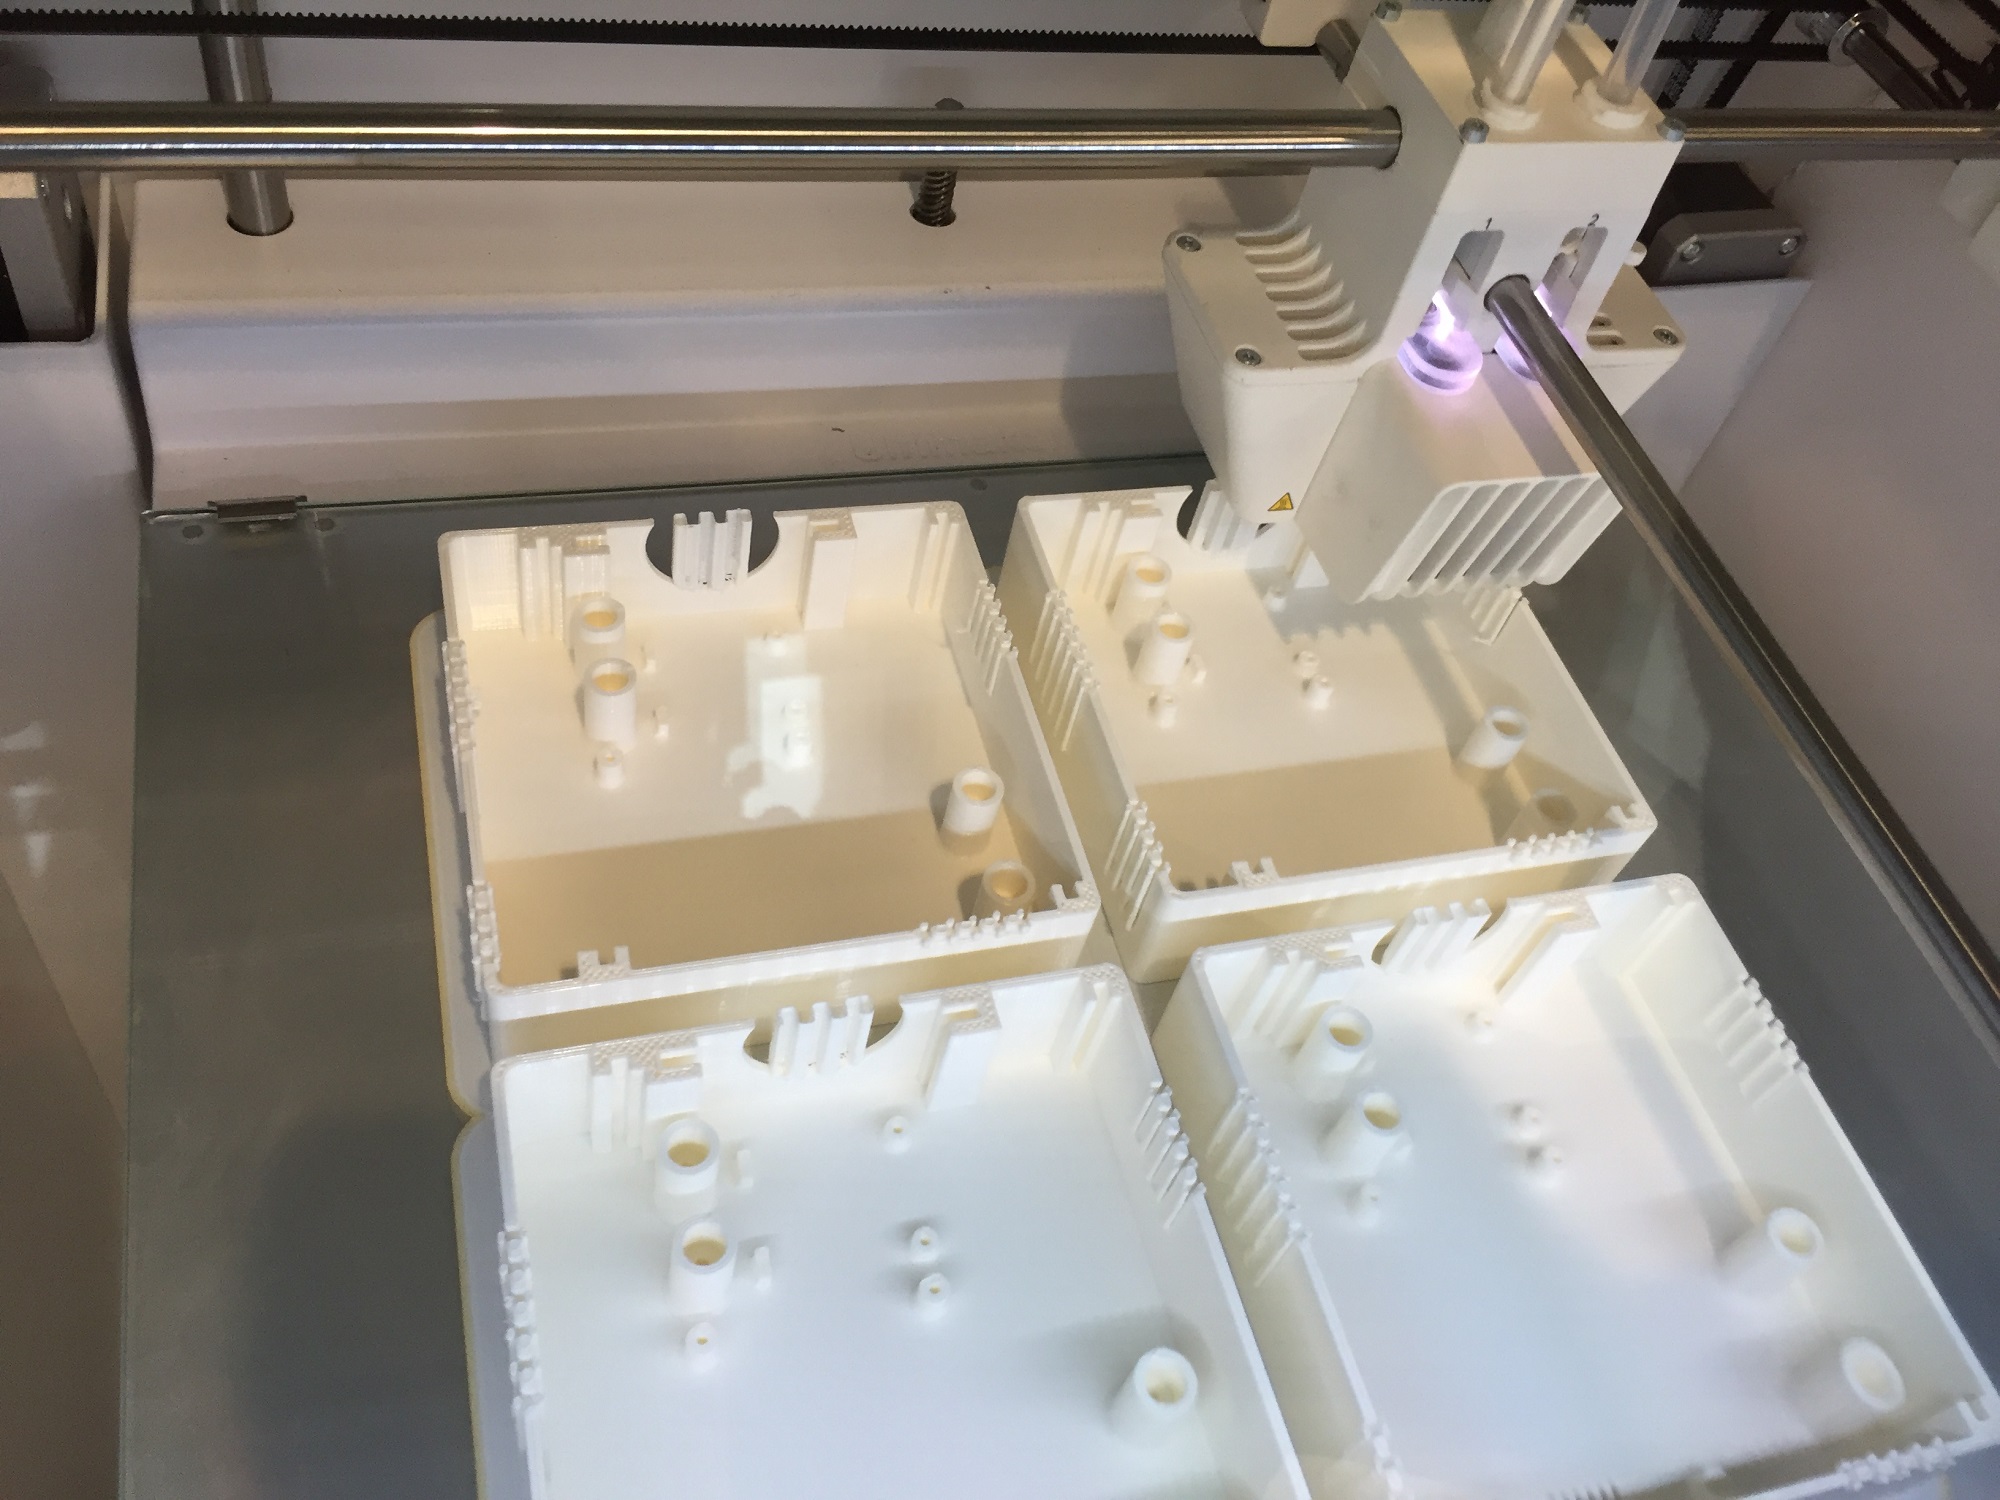
COACH boxes being 3D-printed in an Ultimaker
Post-Deployment Calibration
After deployment, some CO2 sensors began losing calibration, leading to a shift in readings. To address this, we used a reference meter to highlight which sensors have the largest drift. Corrections were made on the server side to ensure data accuracy.
Temperature Sensor Accuracy
One of the challenges encountered after deployment was the value shift of the temperature sensors. Due to the compact design of the enclosure and the heat generated by other components, the temperature sensors consistently reported readings 2 to 3 degrees higher than the actual ambient temperature. The primary heat sources were the millimetre wave radar, the CO2 sensor, and the MKR1010 microcontroller. Despite adding more ventilation openings, getting the sensor further away from the heat sources, and using longer wires, the internal temperature of the box remained higher than the external environment. To mitigate this, we focused on detecting temperature changes rather than absolute values, allowing us to identify trends in cubicle heating.


Thermal imaging using Testo thermal camera (thanks to Martin)
Current Deployment and Results
Despite the challenges, we successfully deployed 20 COACH units at Moorfields BrentCross Eye Clinic in London. These units have been operational since February 2024, providing valuable data on environmental conditions and occupancy. Preliminary analysis has revealed interesting patterns in environmental conditions and cubicle usage, which will be detailed in future updates.


Current COACH devices deployed at Brent Cross Eye Clinic, London
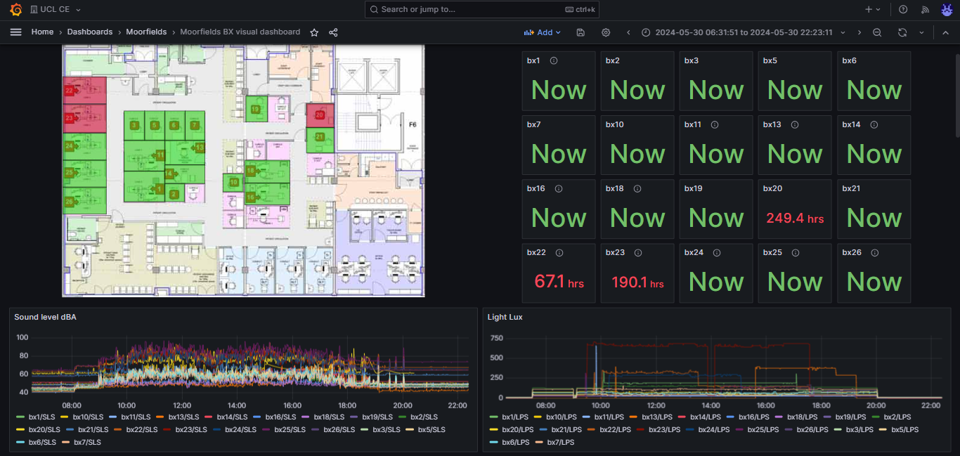
A snapshot of Grafana dashboard shows raw results
Conclusion
The development and deployment of the COACH units have been a complex but rewarding journey. The challenges encountered, from power stability and sensor interference to manufacturing and calibration, provided valuable lessons. Moving forward, one key takeaway is the need to consider separating sensors into multiple packages to reduce complexity and improve accuracy. For example, deploying only the most critical sensors in each cubicle and distributing other sensors as needed could enhance performance and reliability.
Stay tuned for further updates as we continue to analyse the data, refine the device, and explore new ways to enhance the COACH project and contribute to better staff and patient experience within NHS eye clinics.
